
What Does a Bubble Migration Actually Cost? The Architecture Complexity Framework
Real migration costs from agencies and case studies — $12K to $40K+ depending on architecture complexity. A phase-by-phase breakdown of where the money goes, what hidden costs nobody budgets for, and why architecture documentation cuts your total spend by 20–30%.
19 min read
You are ready to migrate your Bubble.io app to custom code. You contact three agencies. Agency A quotes $18,000 and 8 weeks. Agency B quotes $35,000 and 14 weeks. Agency C quotes $55,000 and 20 weeks. All three saw the same app. All three are reputable. So why does the price vary by 3x?
The answer is not that someone is overcharging. It is that migration cost is determined by architecture complexity — workflow depth, data relationship density, integration count, and cutover requirements — and each agency assessed that complexity differently. The teams that get accurate quotes are the ones who measure their architecture before asking for estimates.
Why Most Migration Estimates Are Wrong
The standard migration scoping process is broken in a specific, predictable way. It estimates based on what is visible — pages, features, user roles — while the actual cost is driven by what is invisible.
The Feature Count Fallacy
Most agencies scope migrations by counting screens, user-facing features, and integrations visible during a demo. "15 pages, 8 features, 3 integrations — roughly 10 weeks." This approach works for traditional code-to-code migrations where the source is readable. It fails for Bubble migrations because the backend is a black box.
A Bubble app with 10 pages might have 5 backend workflows or 50. The demo shows neither. An app with 3 visible API integrations might have 8 API Connector entries, each with multiple endpoints, conditional headers, and retry logic. A "simple" data model with 15 types might contain list fields creating implicit many-to-many relationships that require join tables in a relational database — schema design work that was invisible in the estimate.
The Practitioner's View
Nick Sng of bubblemigration.com, a specialist in Bubble migrations, frames it directly: migration pricing is based on "workflow depth, data complexity, integration risk, and rollout requirements — not just screen count." This is the thesis that separates accurate estimates from ones that double during development.
The Four Architecture Complexity Drivers
After analyzing published case studies and agency pricing models, four factors consistently determine migration cost. Each one multiplies the others — a complex data model with complex workflows costs more than the sum of each individually.
Driver 1: Workflow Depth
The number and complexity of backend workflows is the strongest predictor of migration cost. A workflow with 3 linear actions is straightforward to translate. A workflow with 12 actions, nested conditions, recursive list processing, and error handling branches requires careful decomposition into API endpoints, background jobs, and state machines.
Scheduled workflows — jobs that run every hour, every day, every week — add cost disproportionately because they require background job infrastructure (BullMQ, Inngest, Trigger.dev) that does not exist in a simple web application. Each scheduled workflow needs its own monitoring, error handling, and retry logic.
Driver 2: Data Relationship Density
Bubble's data model looks relational but is not. Fields can contain lists of references (implicit many-to-many without join tables), circular relationships between types, and denormalized structures created to work around privacy rule performance. Migrating to PostgreSQL or MySQL requires redesigning these structures into proper relational schemas — a process that scales with the number of relationships, not the number of types.
An app with 20 data types and clean one-to-many relationships migrates faster than an app with 12 types tangled in circular references and list fields. The type count is misleading.
Driver 3: Integration Risk
Each API Connector entry in Bubble represents an external integration with its own authentication method, endpoint structure, header configuration, and response handling. Payment integrations (Stripe, PayPal) carry the highest risk because they involve subscription lifecycle management, webhook processing, and financial data integrity. Auth integrations (OAuth providers, SSO) are similarly complex because they touch every authenticated request.
The risk is not in the number of integrations but in their criticality. A broken analytics integration is a monitoring issue. A broken payment integration is a revenue-stopping emergency.
Driver 4: Cutover Tolerance
How much downtime can your business tolerate during the switch? A weekend cutover with 24 to 48 hours of planned downtime is the simplest and cheapest approach. A zero-downtime migration with parallel systems, gradual traffic shifting, and real-time data synchronization between Bubble and the new system can double the infrastructure and testing budget.
| Driver | Low Complexity | High Complexity | Cost Impact |
|---|---|---|---|
| Workflow depth | 5–10 simple workflows | 15+ with scheduling, recursion, branching | +$5K–$15K |
| Data relationships | Clean one-to-many, few types | Circular refs, list fields, denormalized | +$3K–$8K |
| Integration risk | 2–3 non-critical APIs | Payment, auth, 5+ critical APIs | +$4K–$12K |
| Cutover tolerance | Weekend downtime OK | Zero-downtime required | +$5K–$10K |
These drivers multiply, not add. A high-complexity app across all four dimensions does not cost 4x a simple app — it can cost 6x to 8x because complex workflows that touch complex data models through critical integrations create exponentially more test cases, edge cases, and failure modes.
Real Migration Costs by App Complexity
Here are the actual numbers from agencies and consultants who specialize in Bubble migrations — not hypothetical ranges but published pricing from practitioners with completed projects.
Agency Pricing Data
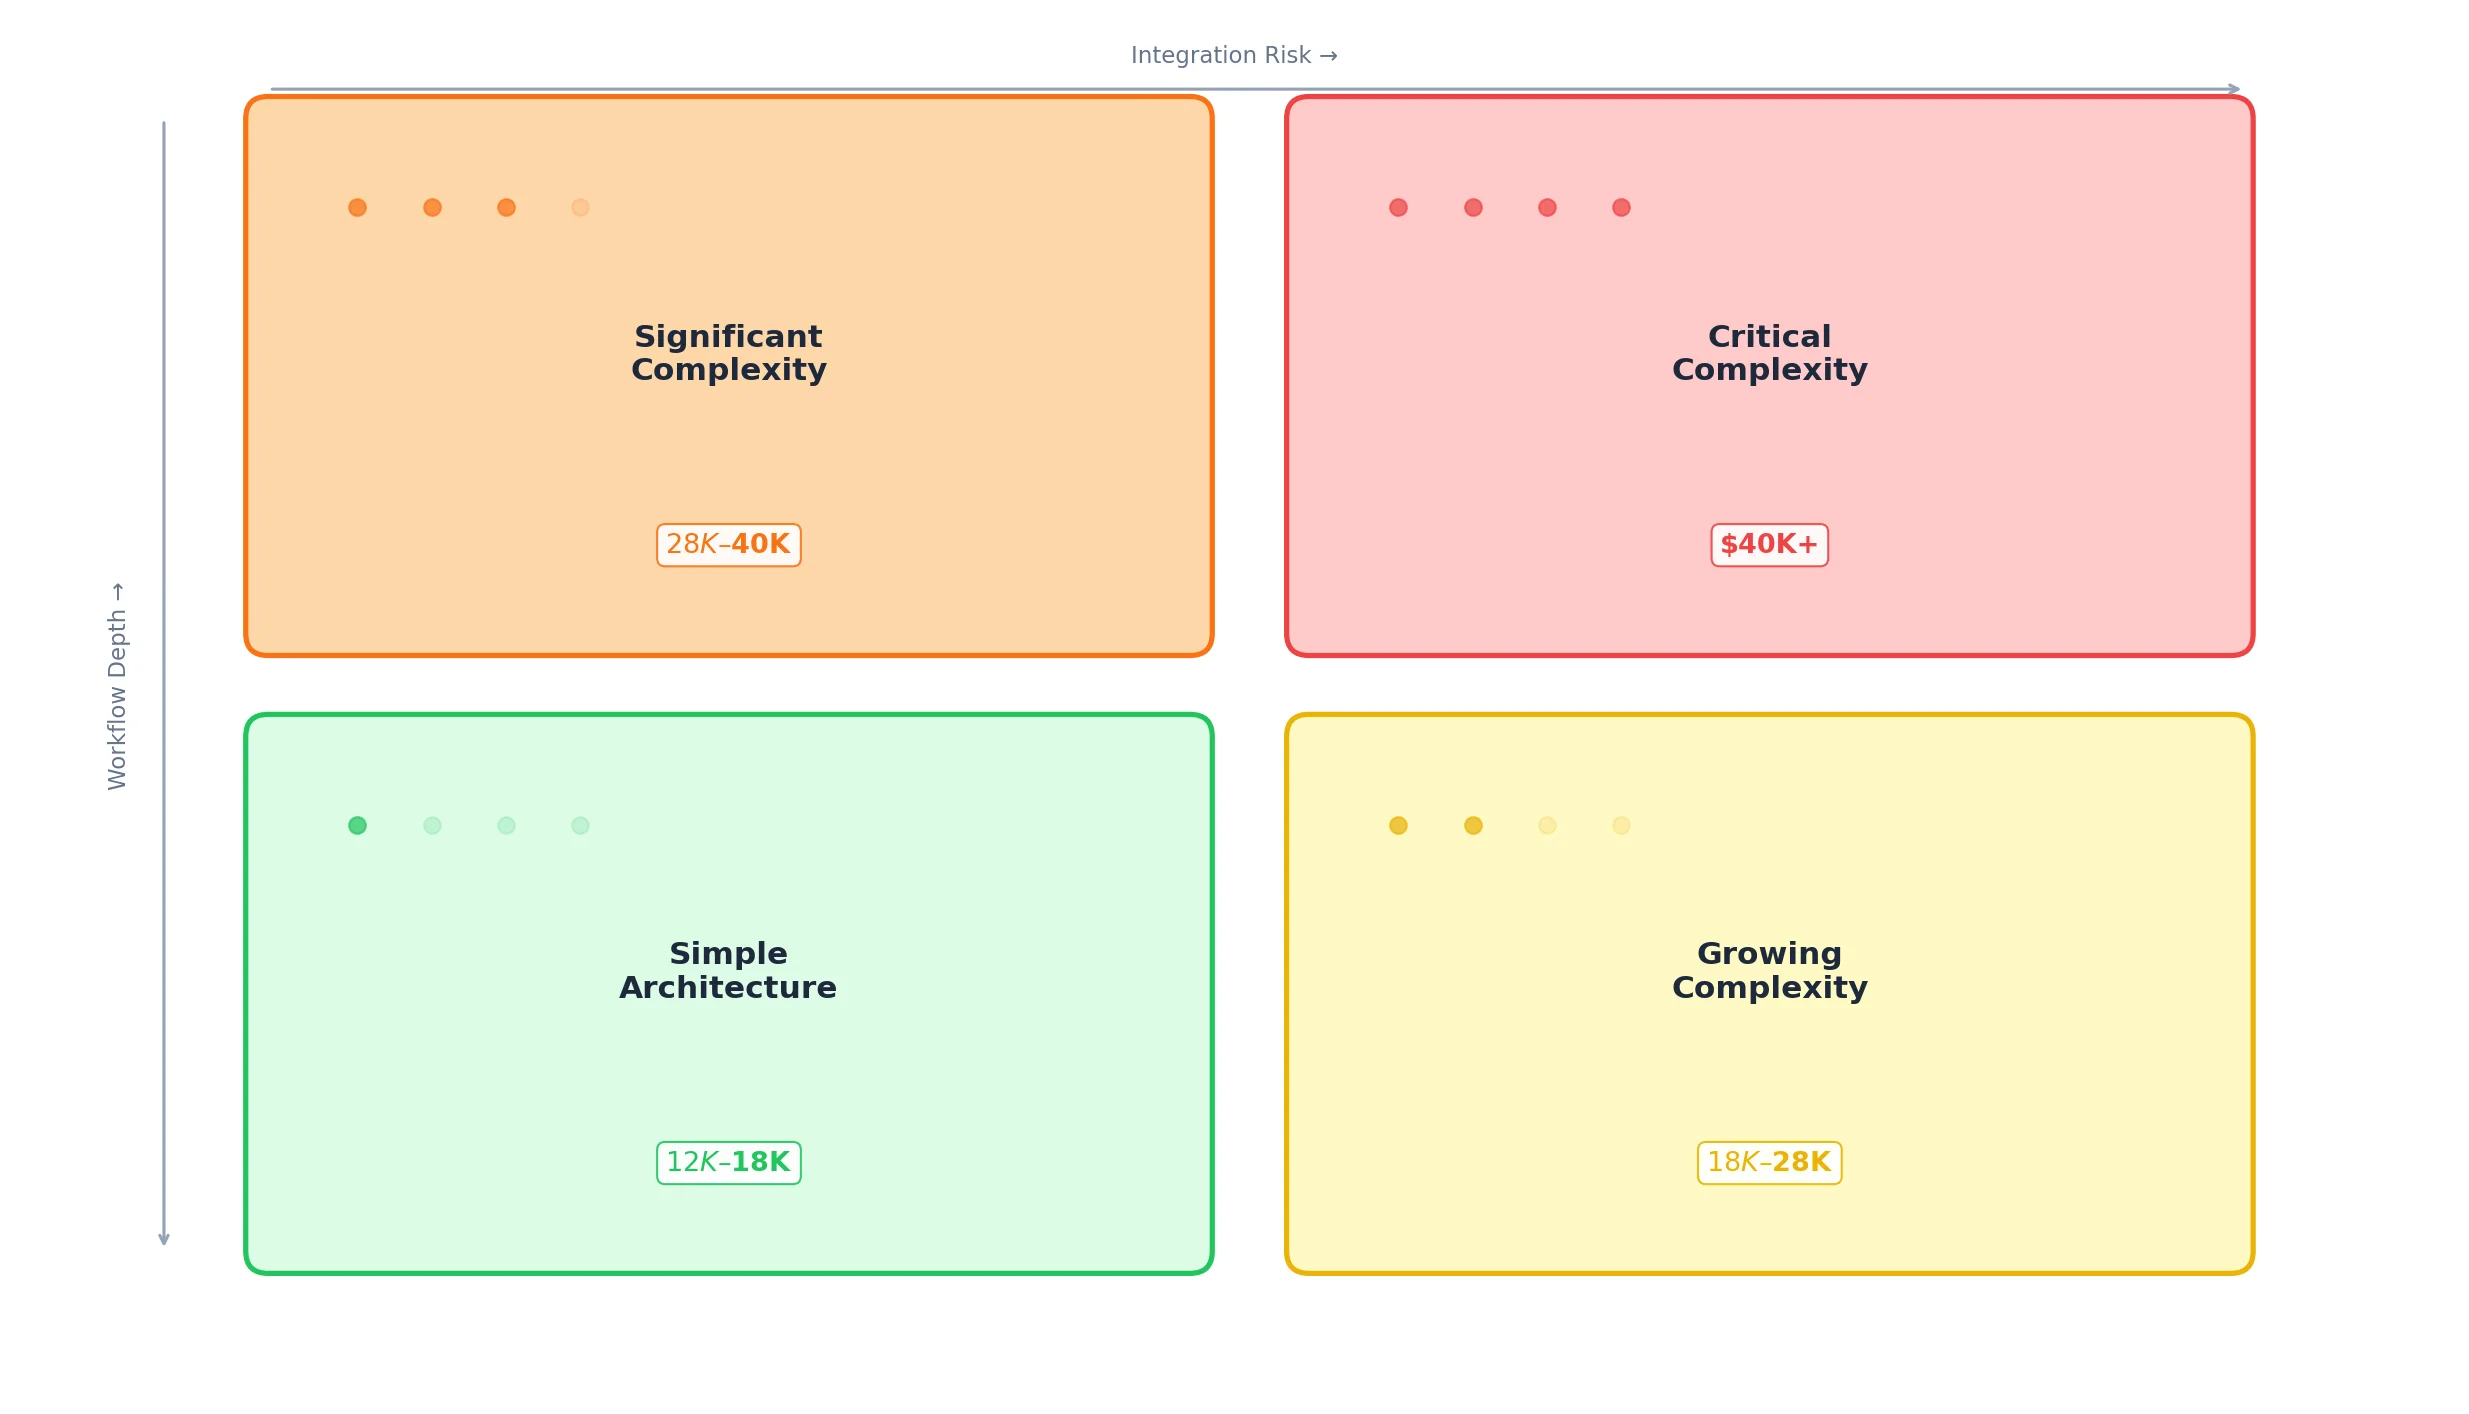
| Tier | Architecture Profile | Cost Range | Timeline |
|---|---|---|---|
| Simple | ~10 data types, 2–3 APIs, few backend workflows, under 500 users | $12,000–$18,000 | 6–8 weeks |
| Mid-complexity | ~20 data types, 5–8 APIs, multi-role permissions, 500–2K users | $18,000–$40,000 | 10–14 weeks |
| Complex platform | 30+ data types, 10+ APIs, multi-tenant, scheduled workflows, 2K+ users | $40,000+ | 14–20 weeks |
Sources: bubblemigration.com (Nick Sng, specialist consultant) and DBB Software (agency with published case studies), supplemented by composite ranges that triangulate across multiple specialist agencies' published guides.
What Determines Your Tier
The gap between a $15,000 migration and a $45,000 one is not the agency's profit margin — it is the work required to handle architecture complexity. A $15,000 project has a clean data model, a few straightforward API integrations, and minimal backend workflow logic. A $45,000 project has denormalized data structures, payment processing with subscription lifecycle management, 15 background workflows running on schedules, and multi-role privacy rules that need to be translated into row-level security policies.
Specialist Bubble migration practitioners executing live multi-app migrations often describe per-platform timelines that land in roughly the multi-month range — practitioner accounts commonly cluster around 3 to 5 months for source apps with multiple years of accumulated Bubble development, even with AI-assisted code generation. Years of accumulated workflow logic, data model decisions, and integration patches create structural complexity that no amount of AI acceleration can fully shortcut.
Where the Money Goes: Cost by Phase
A migration is not a single block of work. It breaks into seven distinct phases, each consuming a predictable share of the budget. Understanding this breakdown prevents the most common budgeting mistake: allocating 100% to development and discovering that testing, data migration, and cutover need their own budgets.
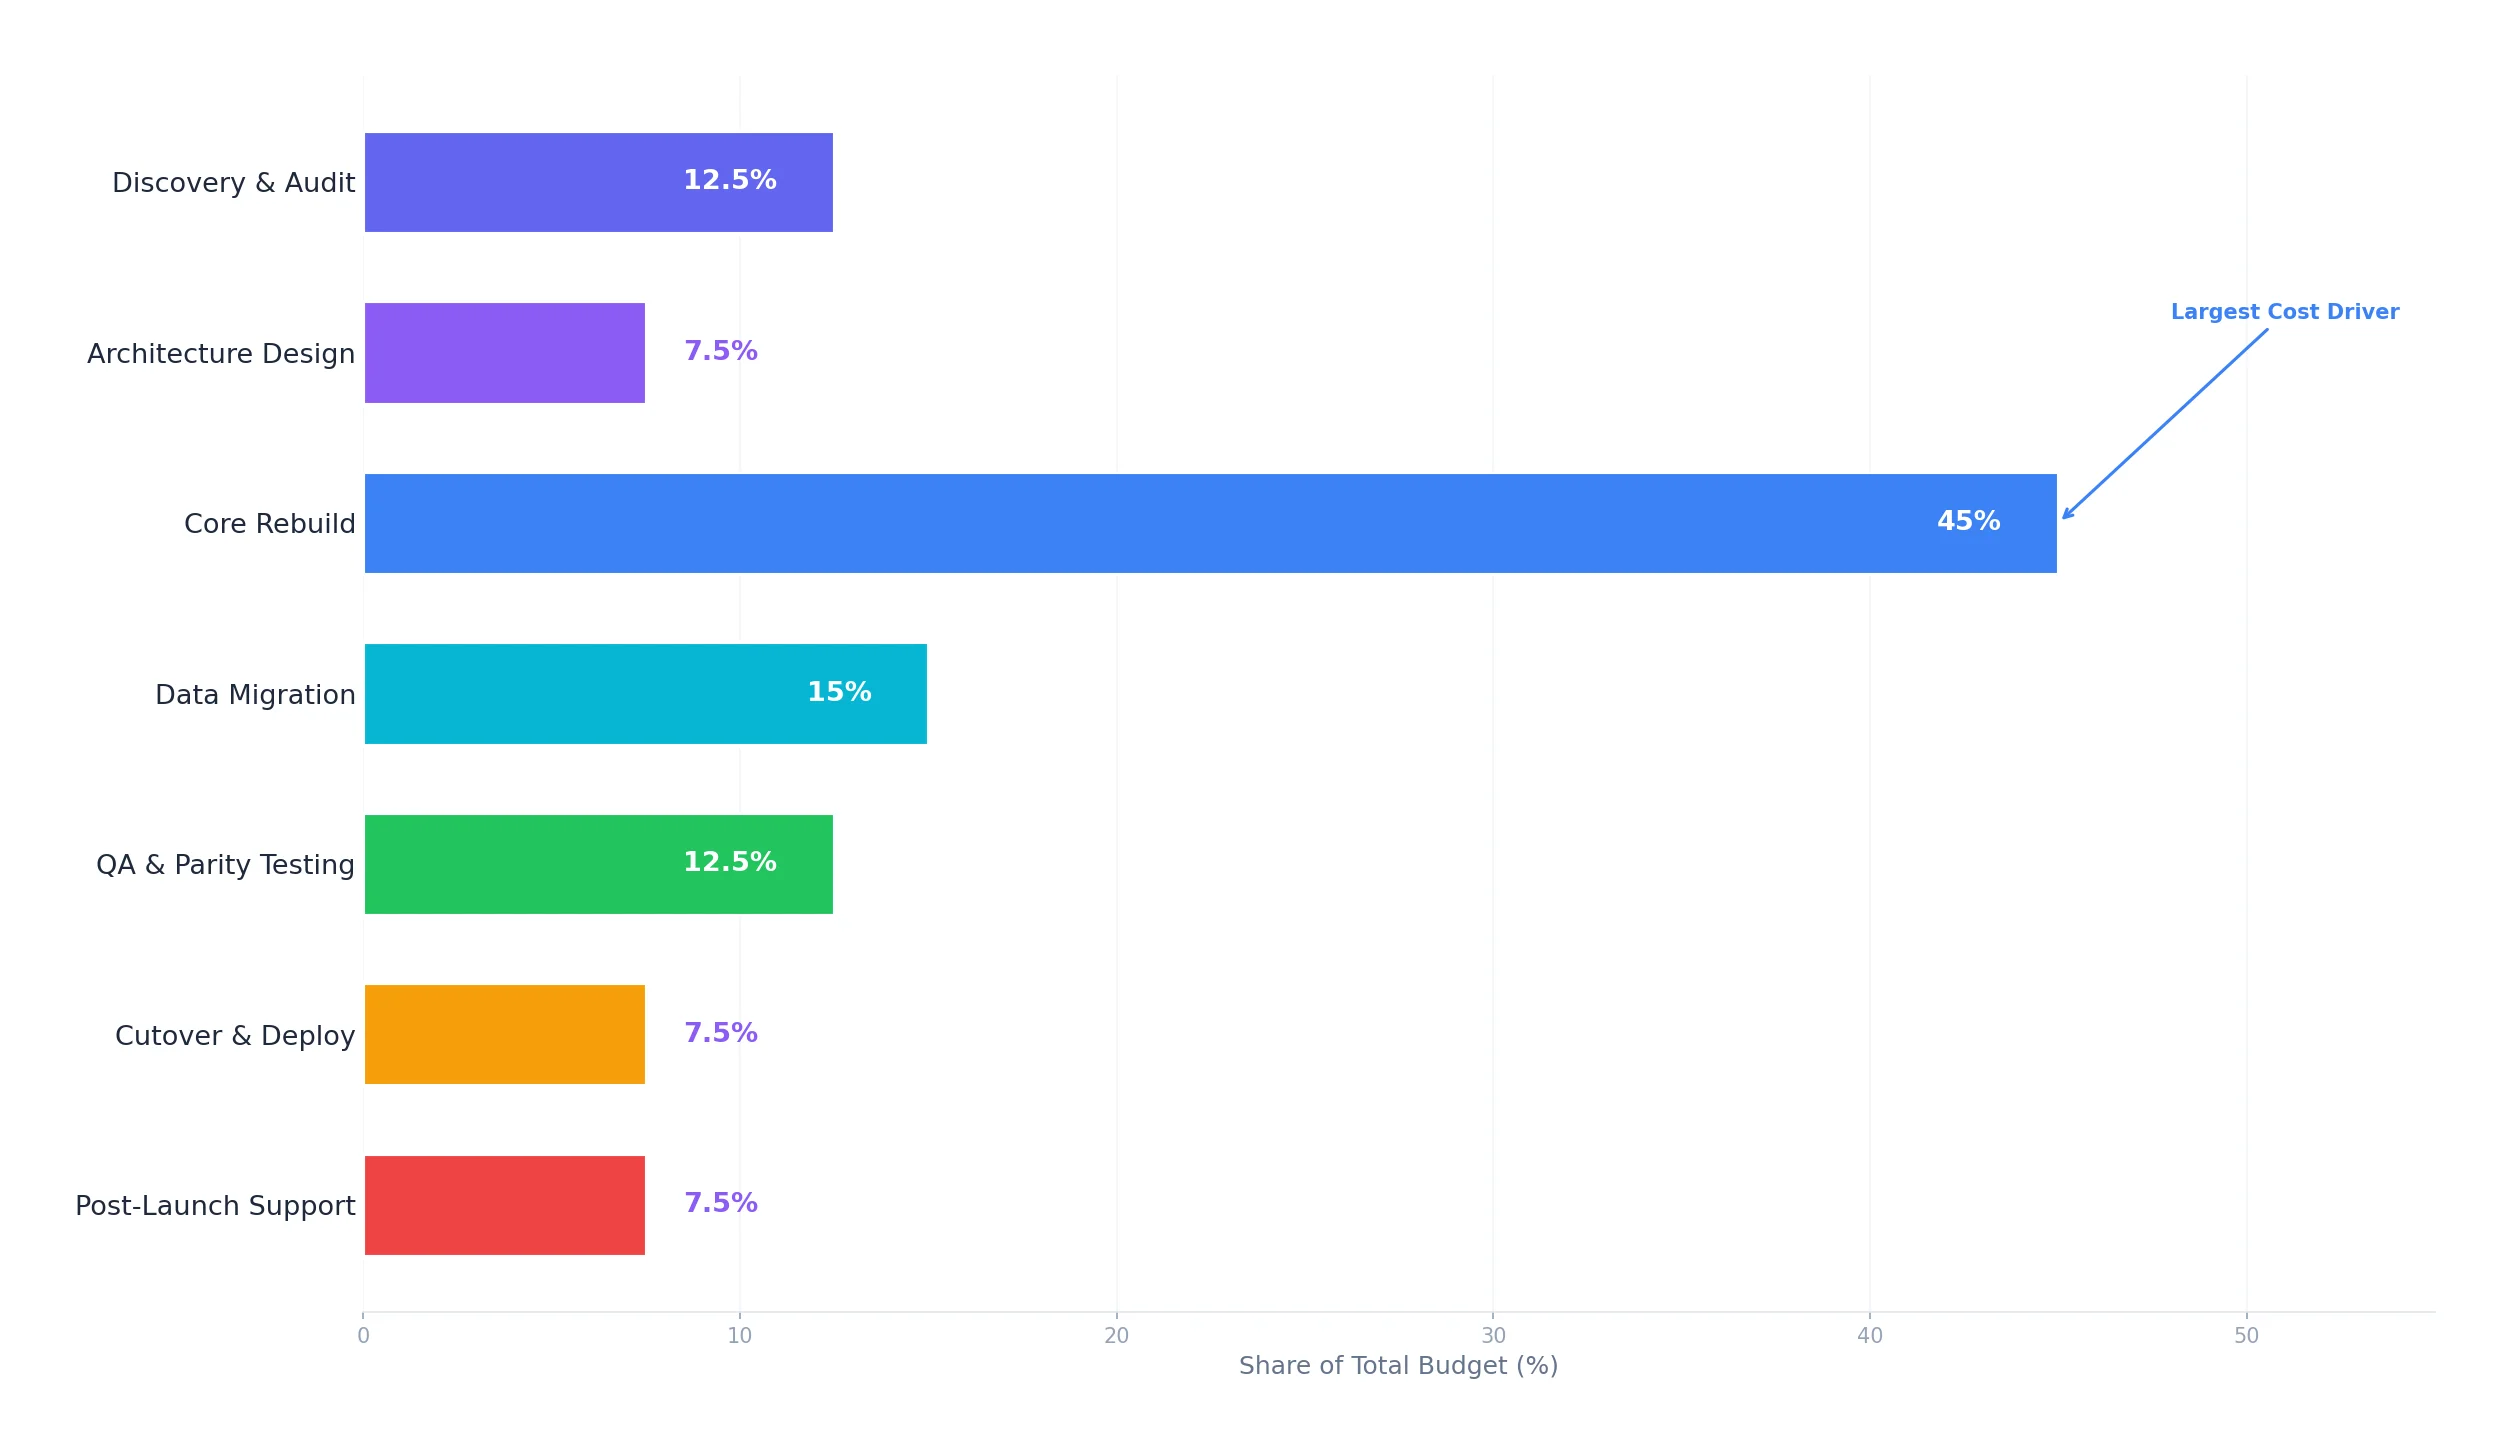
| Phase | Budget Share | What Drives the Cost |
|---|---|---|
| Discovery and audit | 10–15% | Mapping workflows, privacy rules, plugin dependencies, data quality assessment |
| Architecture design | 5–10% | Schema redesign, tech stack decisions, cutover planning |
| Core rebuild | 40–50% | Frontend parity, backend logic translation, auth system rebuild |
| Data migration | 10–20% | Export scripts, data normalization, integrity verification, staging runs |
| QA and parity testing | 10–15% | Regression testing against Bubble behavior, integration end-to-end tests |
| Cutover and deployment | 5–10% | DNS switch, parallel system period, webhook URL updates, user communication |
| Post-launch support | 5–10% | Support spike (first 2 weeks), edge case fixes, monitoring setup |
The Discovery Tax
Discovery — the phase where developers map your Bubble app's architecture — is the most underbudgeted phase and the one that determines the accuracy of everything that follows. Agencies that skip or abbreviate discovery produce estimates based on incomplete information. The missing scope shows up later as timeline overruns that cost far more than the discovery phase would have.
A thorough manual discovery for a mid-complexity app takes 40 to 120 hours at $100 to $200 per hour — $4,000 to $24,000 just to understand what needs to be built. This is 10 to 15 percent of the total project budget, but it is the 10 to 15 percent that makes the other 85 to 90 percent predictable.
Post-Launch Is Real Work
Migration practitioners consistently report that even with thorough staging tests, real users surface edge cases that staging environments miss, and support tickets typically spike in the first two weeks after cutover. Teams that declare victory at deployment and disband the migration team learn this the expensive way.
The Hidden Costs Nobody Budgets For
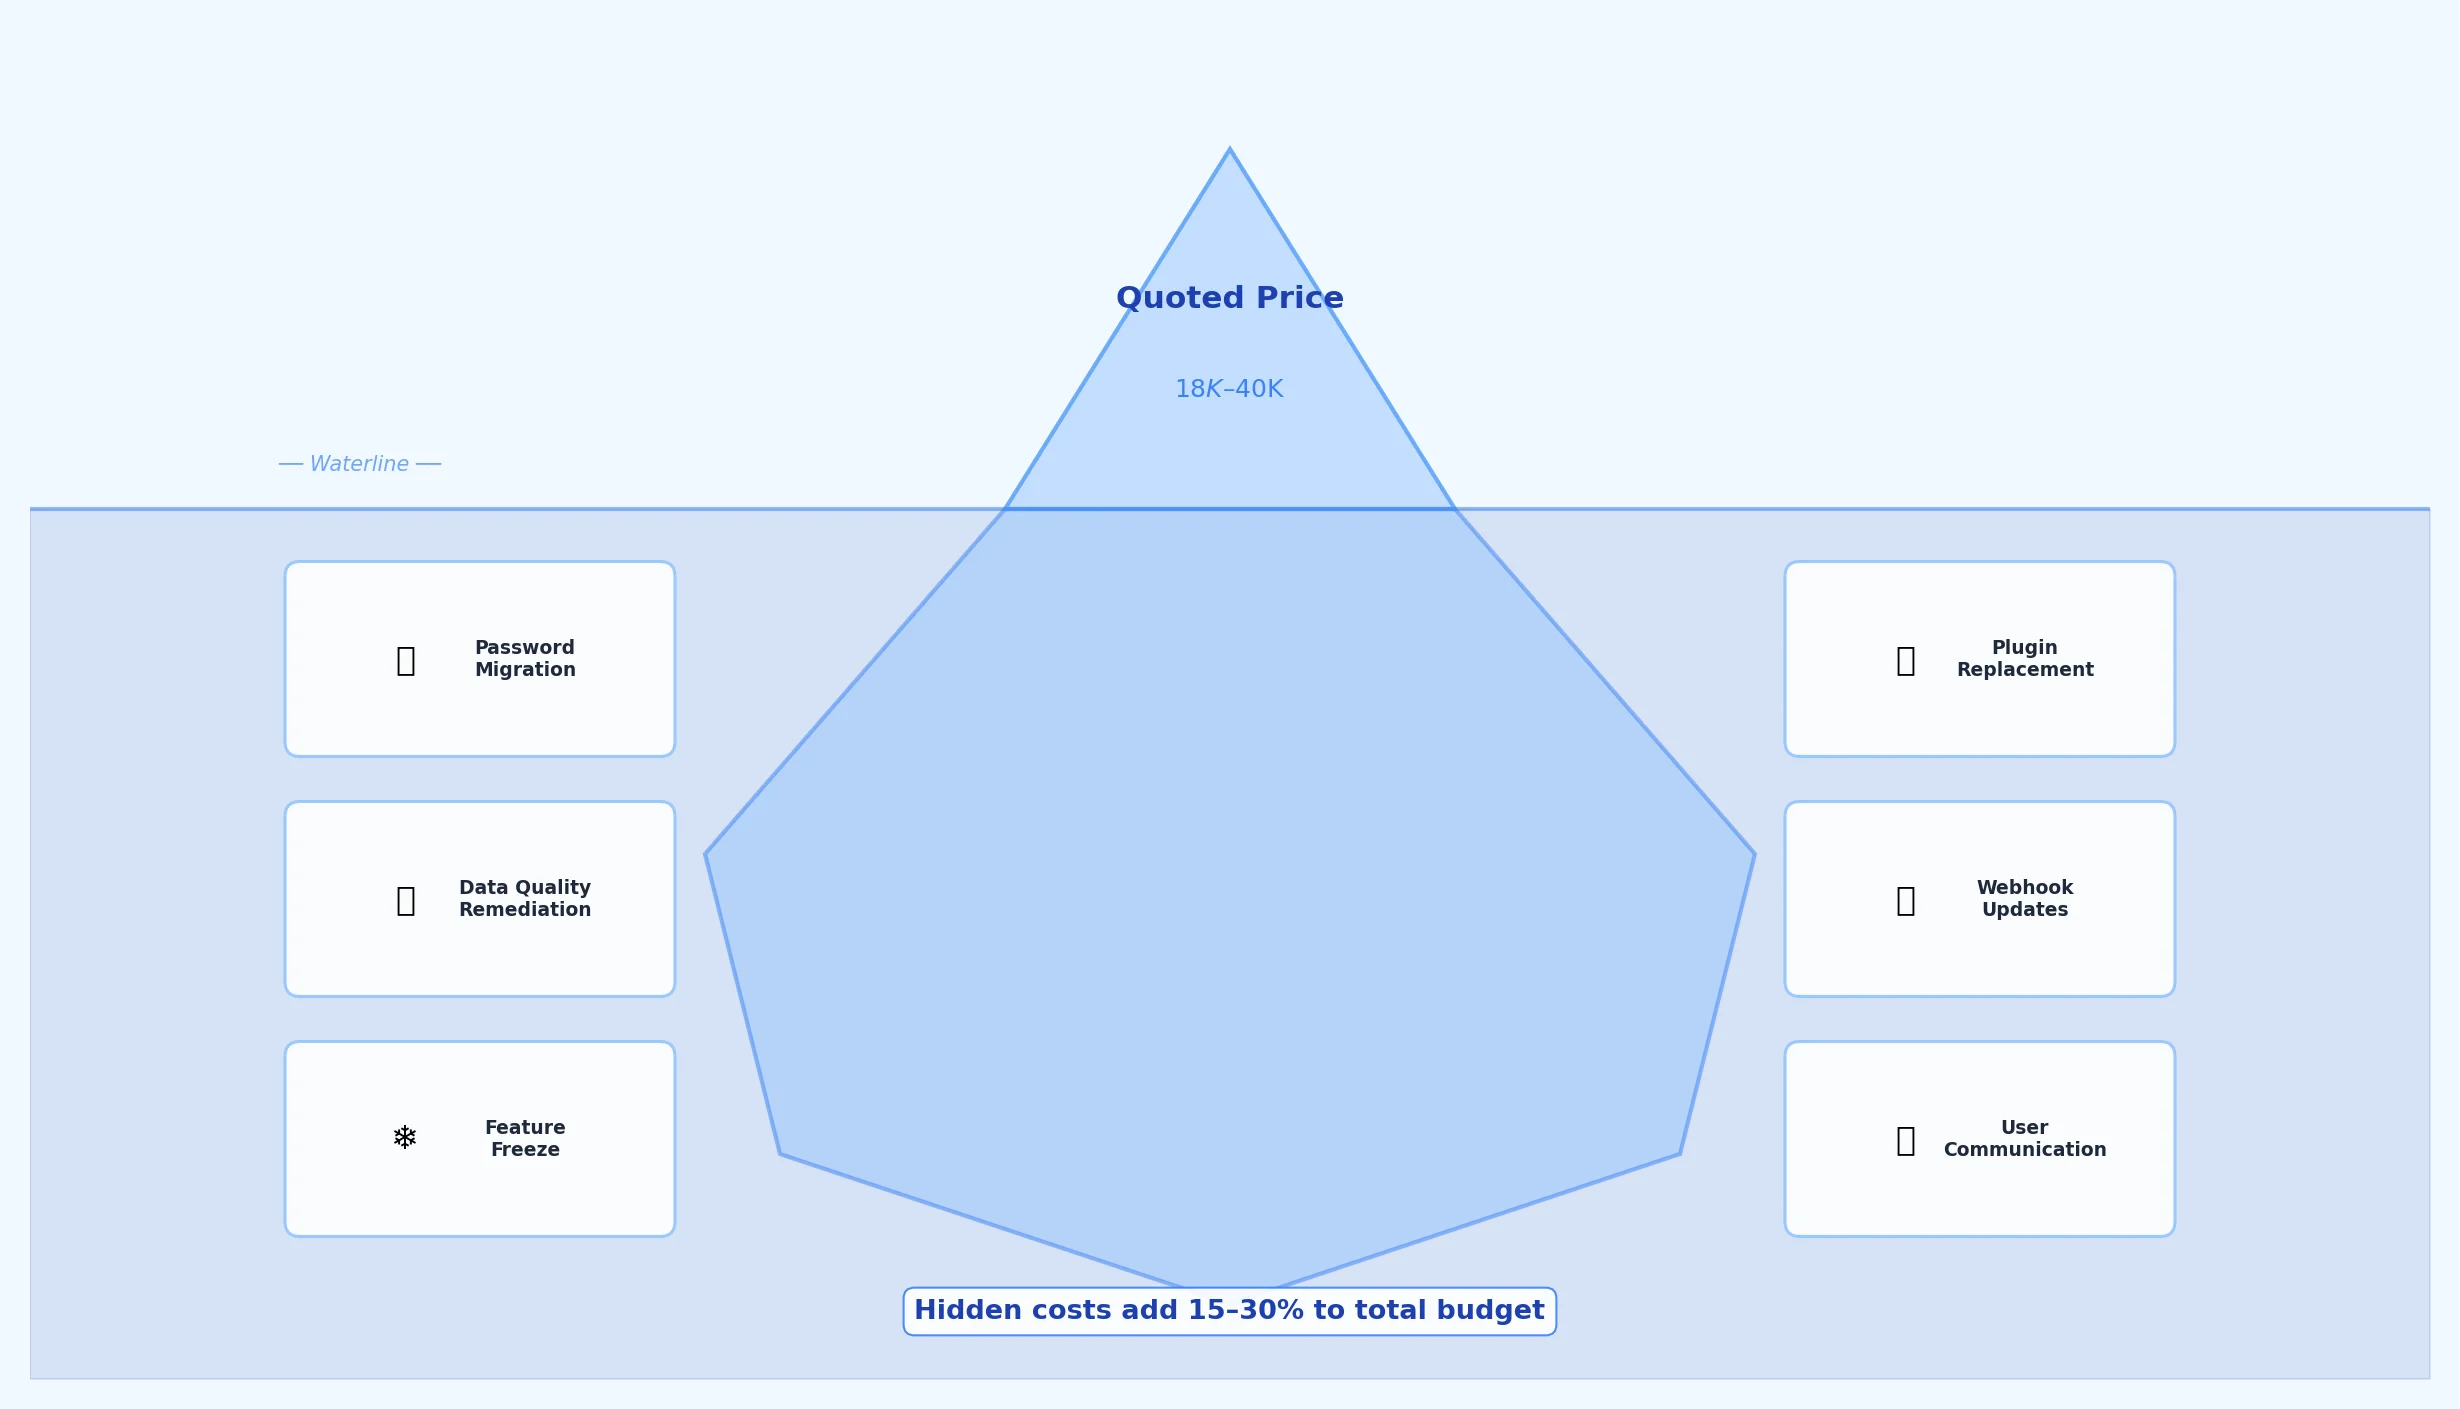
Every published migration cost range assumes a clean project. Real migrations have hidden costs that can add 15 to 30 percent on top of the quoted price.
The Password Problem
Bubble does not export password hashes. The hashing methodology is proprietary and undisclosed. Every migration requires a forced re-authentication event for all users — magic link, one-time password, or password reset flow. This is not a trivial feature. It requires email templates, verification logic, fallback handling for users who do not complete re-auth, and a communication plan so users know what to expect. Teams that discover this during cutover weekend face a crisis.
Data Quality Debt
Production Bubble databases accumulate structural debt over time: orphaned records from deleted relationships, null fields from schema changes, inconsistent data types from years of manual edits, and file URLs pointing to Bubble's CDN that need to be migrated to your own storage. Agency reports describe developers spending a substantial share of data-migration time on data-quality issues that were invisible in Bubble — often a meaningful chunk of the data-migration phase rather than a rounding error.
Feature Freeze Cost
During migration, your Bubble app should be frozen or minimally maintained. For apps with active users, this means 3 to 5 months with no new features. The cost does not appear on any invoice, but it affects user retention, competitive positioning, and team morale. Budget for it in your planning even if you cannot put a dollar amount on it.
The Plugin Replacement Gap
Bubble plugins encapsulate significant functionality behind a single "action" block. A Stripe plugin might handle subscription creation, proration, dunning emails, and webhook processing. When you remove the plugin, you need to rebuild everything it was doing — not just the visible action. The migration roadmap should account for every plugin and its hidden functionality.
- Password migration: Forced re-auth flow for all users (magic link or OTP)
- Data cleanup: Orphaned records, null fields, inconsistent types, CDN file migration
- Feature freeze: 3–5 months without shipping new features
- Plugin replacement: Rebuild hidden functionality from Stripe, SendGrid, Twilio plugins
- Webhook updates: Every third-party service pointing to Bubble needs URL updates
- User communication: Email campaigns explaining the migration, new login flow, and support channels
How Architecture Documentation Changes the Math
The single biggest lever for reducing migration cost is not choosing cheaper developers or cutting scope — it is measuring architecture complexity before asking for quotes.
The Quote Accuracy Problem
When three agencies give you quotes ranging from $18,000 to $55,000, the variance comes from different assumptions about hidden complexity. Agency A assumes your backend workflows are simple. Agency B assumes they are moderate. Agency C assumes they are complex and adds contingency. None of them actually know — because nobody measured.
With a complete architecture blueprint, the scoping conversation changes. Instead of "we saw 15 pages in a demo," it becomes "we have 22 data types with 147 fields, 12 backend workflows including 3 scheduled ones, 8 API connectors with 23 endpoints, and 34 privacy rules." Every agency is now quoting from the same specification. Quotes converge. Surprises disappear.

The Automated Documentation Option
Relis extracts your complete Bubble backend architecture — data schemas, API connector configurations, backend workflow logic, and app settings — into 9 standardized document types in under 10 minutes. The extraction covers the exact information agencies need to produce accurate quotes: data type count with field-level detail, workflow count with trigger conditions and action sequences, API connector count with endpoint specifications, and Option Set inventories.
Teams using structured architecture documentation may report meaningful reductions in total migration cost compared to teams that start without it — practitioner accounts often land in a 20 to 30 percent band for well-scoped projects, though the figure is hedged in the methodology note. The savings come from three sources: eliminated discovery phase billing, reduced rework from late-discovered features, and the ability to negotiate from a position of information symmetry with agencies.
Feed Documentation to AI for Faster Rebuilds
Migration agencies and teams using AI coding tools commonly report substantial development-time reduction — often described as features that previously took weeks now taking days — when the inputs are structured. But this acceleration only works with structured input. AI coding tools like Cursor and Claude generate working endpoints from detailed API specifications. They generate database schemas from ERD diagrams. They generate background job handlers from workflow documentation. They hallucinate from vague descriptions. The architecture documentation is not just for quotes — it is the input that makes AI-accelerated development possible.
Across published no-code-to-custom-code retrospectives, post-MVP migration is reported as the common path for successful Bubble products that scale beyond their initial validation phase, not the exception. Migration is therefore better treated as the expected lifecycle of a successful Bubble product, not an edge case. The question is not whether you will migrate but how prepared you will be when the time comes. Documenting your architecture now — even before you decide to migrate — is the cheapest insurance against future migration costs.
Frequently Asked Questions
Q. Why do migration quotes vary so much between agencies?
Because each agency is guessing at your backend complexity differently. Without architecture documentation, agencies estimate from a demo — and a demo shows the frontend, not the backend workflows, privacy rules, or API connector configurations that drive actual development time. Providing the same architecture blueprint to every agency produces convergent quotes.
Q. Is it cheaper to migrate in-house or hire an agency?
In-house is cheaper if you have developers experienced with both Bubble's architecture patterns and your target stack. Agency is faster and carries less risk if your team lacks migration experience. A hybrid approach — agency for architecture design and core rebuild, in-house for feature parity and testing — balances cost and speed for most mid-complexity projects.
Q. How long does it take for migration to pay for itself?
Published agency break-even models commonly land in the 6 to 12 month range, depending on how much your team spends on Bubble (plan plus freelancer patches) and the size of your migration investment. Teams with higher recurring Bubble costs break even faster after a mid-range migration; teams with low Bubble spend may need a year or more to recover migration costs through platform-fee savings alone, with the rest of the value showing up in product velocity rather than line-item savings.
Q. Can AI tools significantly reduce migration cost?
Yes, but only with structured architecture documentation as input. Practitioner reports commonly describe AI-assisted code generation cutting per-feature build time by a multiple — features that took weeks in Bubble taking days in custom code — when fed clear specifications. The architecture audit phase is unchanged: AI cannot discover what your hidden workflows do. The cost savings come from faster development, not faster discovery.
Q. What is the single biggest hidden cost in Bubble migrations?
Data quality remediation. Production Bubble databases accumulate orphaned records, null fields, inconsistent types, and denormalized structures over years of development. Agency reports describe developers spending a substantial share of data-migration time on data-quality issues. Budget 10 to 20 percent of total project cost for data migration specifically.
Measure Complexity First, Then Budget
- Feature count does not predict cost: Architecture complexity — workflow depth, data relationship density, integration risk, and cutover tolerance — determines your actual migration price. Two apps with identical frontends can cost 3x different to migrate.
- Real costs range from $12K to $40K+: Simple apps with clean architecture start at $12,000. Complex platforms with years of accumulated workflow logic and critical integrations exceed $40,000. Published agency data confirms these ranges consistently.
- Development is less than half the total: Discovery, data migration, testing, cutover, and post-launch support collectively consume 50 to 60 percent of the budget. Teams that allocate 100 percent to development run out of money before launch.
- Hidden costs add 15 to 30 percent: Password migration, data quality cleanup, feature freeze impact, plugin replacement, and webhook updates are real costs that no standard quote includes. Budget for them explicitly.
- Architecture documentation is the highest-ROI investment: Complete documentation may reduce total migration cost on the order of 20 to 30 percent by eliminating the discovery phase, preventing late-discovered scope, and enabling AI-accelerated development — see the methodology note for how we sourced that range.
The cheapest migration is the one where everyone — your team, your agency, your AI tools — starts with the same complete picture of what needs to be built. Measure the complexity. Then budget for it.
Measure Your Architecture Complexity in Minutes
Extract your complete Bubble backend — data schemas, API specs, backend workflows, app settings — into 9 standardized documents. Get accurate migration quotes based on facts, not guesses.
Scan My App — FreeHow Complex Is Your Bubble App?
Find out in minutes. Relis automatically extracts and documents your entire Bubble architecture — data types, APIs, workflows, and settings.
How Complex Is Your Bubble App?
Find out in minutes. Relis automatically extracts and documents your entire Bubble architecture — data types, APIs, workflows, and settings.