
How to Read a Bubble.io Workload Units Bill: Anatomy of Cost Drivers
A field guide to reading a Bubble.io workload-unit bill — six cost drivers, the WU profiler, the anti-patterns that eat budgets, and how to turn the bill into an action plan.
18 min read
Your Bubble.io billing page just refreshed and the workload-unit total is higher than last month. Again. You did not add features, you did not change pricing, and your traffic looks normal in your analytics tool. The dashboard shows you a number and a graph, and that is roughly where the platform's explanation ends. The bill itself does not tell you what to do.
This guide turns that bill into a working document. You will learn where the WU number actually comes from inside Bubble's runtime, the six cost drivers that feed into it, how to read the profiler to find your top ten consumers, the anti-patterns that explain why a small app can burn a large budget, and the decision rubric for whether to optimize or to plan a migration. By the end, you should be able to open next month's invoice and translate it into a concrete action list rather than a feeling.

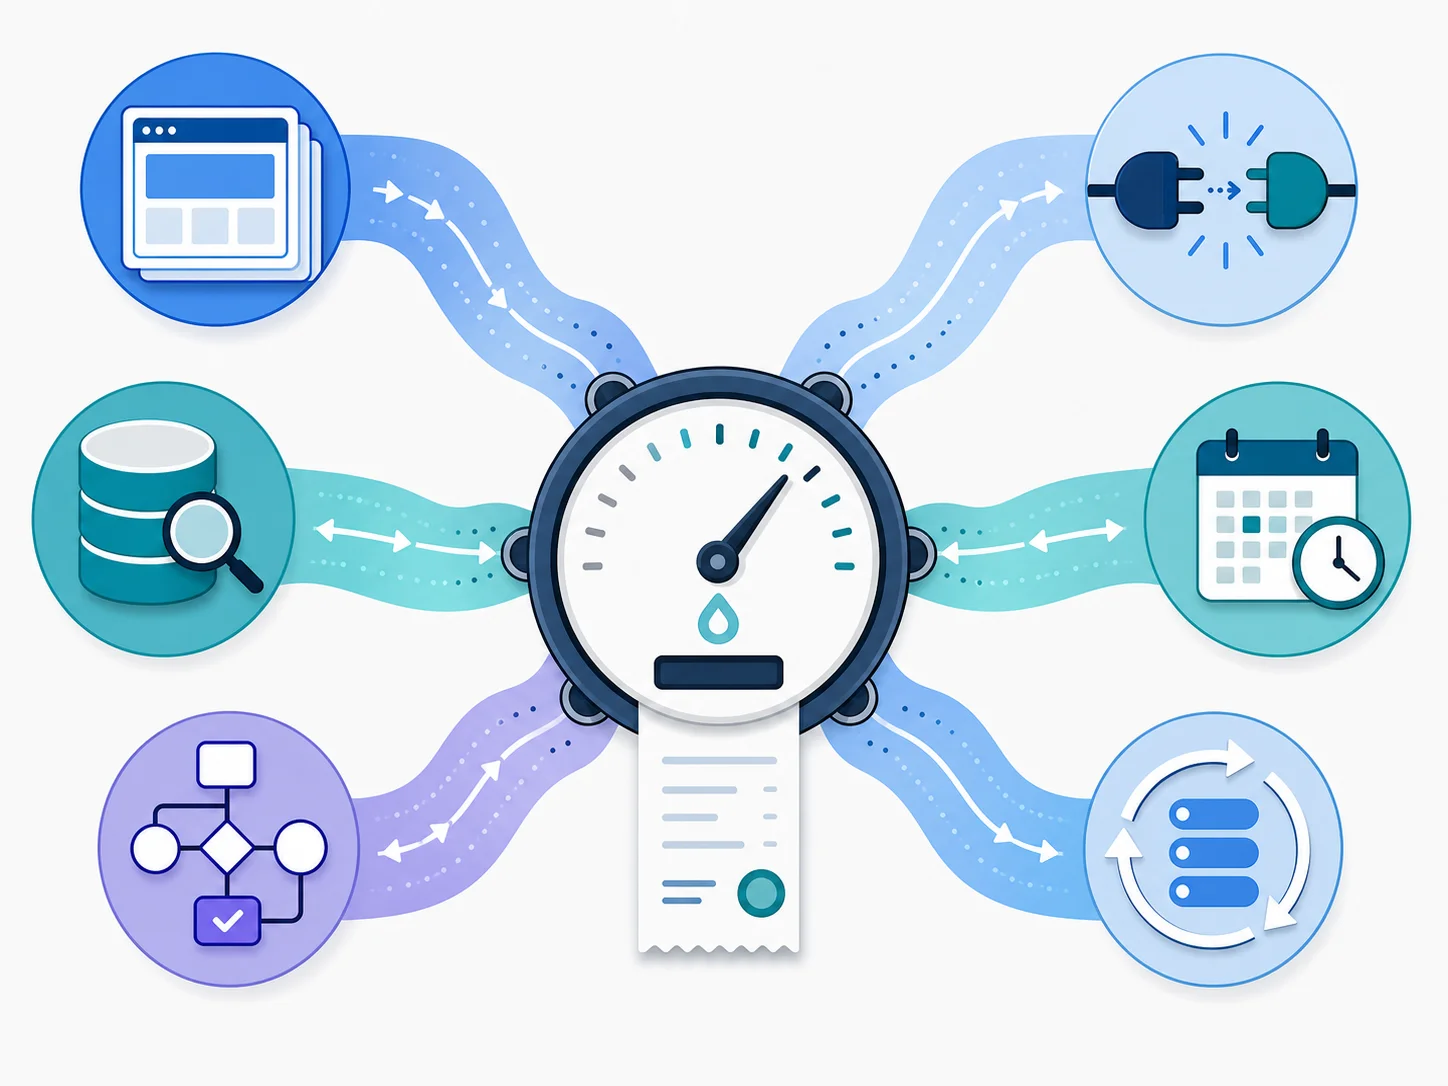
Where Your WU Bill Actually Comes From
The number you see on your billing page is the rolled-up output of Bubble's runtime metering. Every server-side operation your app performs increments a counter; the platform multiplies that counter by the published WU rates and presents the total. Understanding which operations get metered — and how — is the entire game.
The Two Surfaces You Can Watch
Bubble exposes WU consumption in two places. The billing page shows the running total against your plan's allocation, including any overages. The logs view (Settings → Logs → Server logs, with the WU profiler enabled in app settings) shows per-operation consumption for individual workflows and database searches. The billing page tells you the score; the logs view tells you why.
What Gets Metered
WU metering covers six categories of server-side work. Frontend rendering on the user's browser does not consume WUs directly — but every time a page loads server-side data, runs a workflow, evaluates a privacy rule against a search, or calls an external API, the meter ticks. We unpack each driver in the next section.
What Does Not Get Metered (Yet)
Static asset loading, pure client-side state changes, and offline-first behaviors do not consume WUs because they do not hit Bubble's runtime. This matters because some of the cheapest performance optimizations available to you involve moving work from the server to the client — caching repeated searches in custom states, computing derived values in the browser, or reducing the data dependencies on a page so fewer searches fire.
The Six Cost Drivers Inside Every WU Bill
Open any Bubble app's profiler and you will see the same six categories of work showing up as line items. The proportions differ; the categories do not.
| Driver | What It Measures | How It Scales | Optimization Surface |
|---|---|---|---|
| Page loads (server-side) | Server work to render a page's data dependencies | Linearly with active sessions and per-page data complexity | Reduce per-page searches, defer non-critical data |
| Database searches | Each "Do a search for" against a data type | With data volume and constraint complexity | Replace repeating-group searches, index-conscious filters |
| Workflow actions | Each step inside a triggered workflow | Per-action plus condition evaluation | Collapse adjacent steps, push expensive logic to backend |
| API Connector calls | Outbound HTTP to external services | Per-call plus external latency window | Batch endpoints, cache idempotent responses |
| Scheduled backend workflows | Cron-like jobs that run regardless of users | By interval × per-execution cost | Lengthen intervals, retire dead jobs, batch processing |
| Recursive workflows on a list | "Schedule API Workflow on a List" patterns | Per-item, multiplied by list length | Bigger batches, off-peak scheduling, fewer dependencies |
Why the Last Driver Is Different
Five of these drivers scale roughly with how active your app is. The sixth — recursive workflows on a list — scales with whatever data set you point it at, regardless of user activity. A recursive cleanup job over a few thousand records on a short interval can dominate a small app's bill while serving zero user-facing value during peak hours. Most teams discover this only after the invoice arrives.
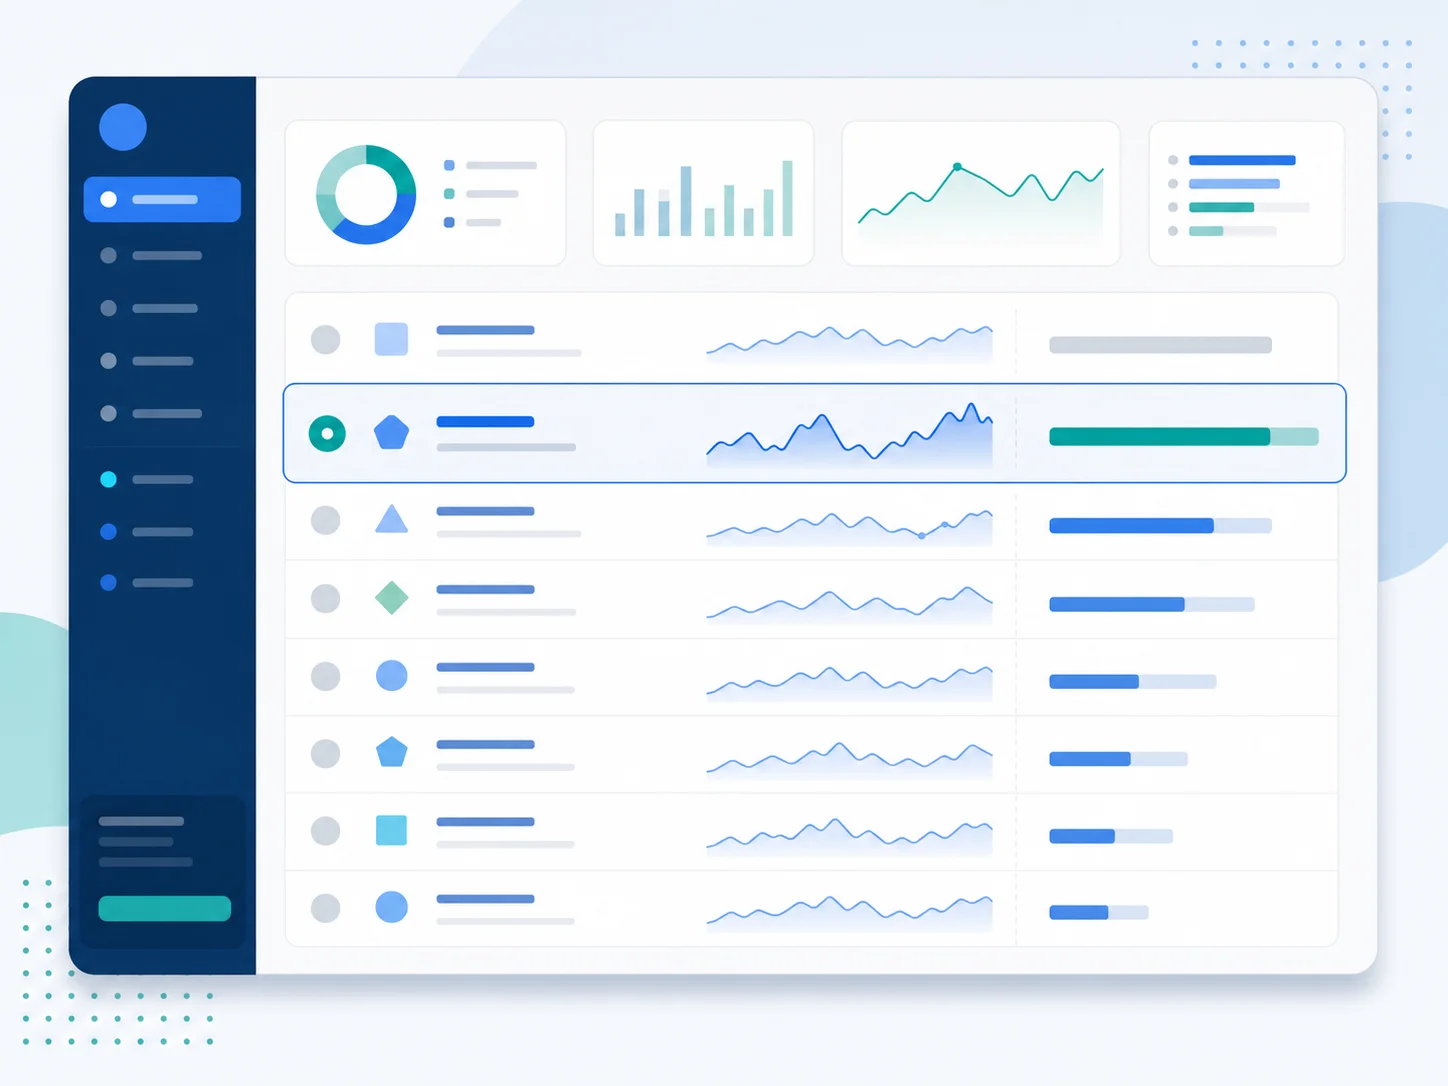
Reading the Profiler — Finding Your Top 10 Consumers
Bubble's WU profiler (enable in app Settings, then navigate to Logs → Server logs) lists each workflow execution and the WUs it consumed. The profiler is the most useful tool you own for cost analysis, and most Bubble teams under-use it.
The Top-10 Method
Run the profiler over a representative day (mid-week, after morning traffic settles) and rank workflows by total WUs consumed. Across the apps we have audited, the top ten line items typically account for the lion's share of the daily total — often most of it. This is not a Bubble-specific phenomenon; it is the long tail showing up in cost data the way it shows up everywhere else.
What to Note for Each Top Consumer
- Trigger source: Page-driven, API-driven, scheduled, or database-trigger
- Per-execution cost: WUs per single run
- Frequency: Executions per day
- Data volume touched: List length, search constraints, joined types
- User-facing value: Does a user notice if this gets slower or runs less often?
Reading the Sparkline
The profiler shows daily-trend sparklines for each workflow. A workflow with a flat sparkline is steady-state — its cost will not change unless you change the workflow. A workflow with a rising sparkline is growing with your data, your users, or both, and it deserves the most scrutiny because it is on a trajectory that will eventually hit your plan ceiling.
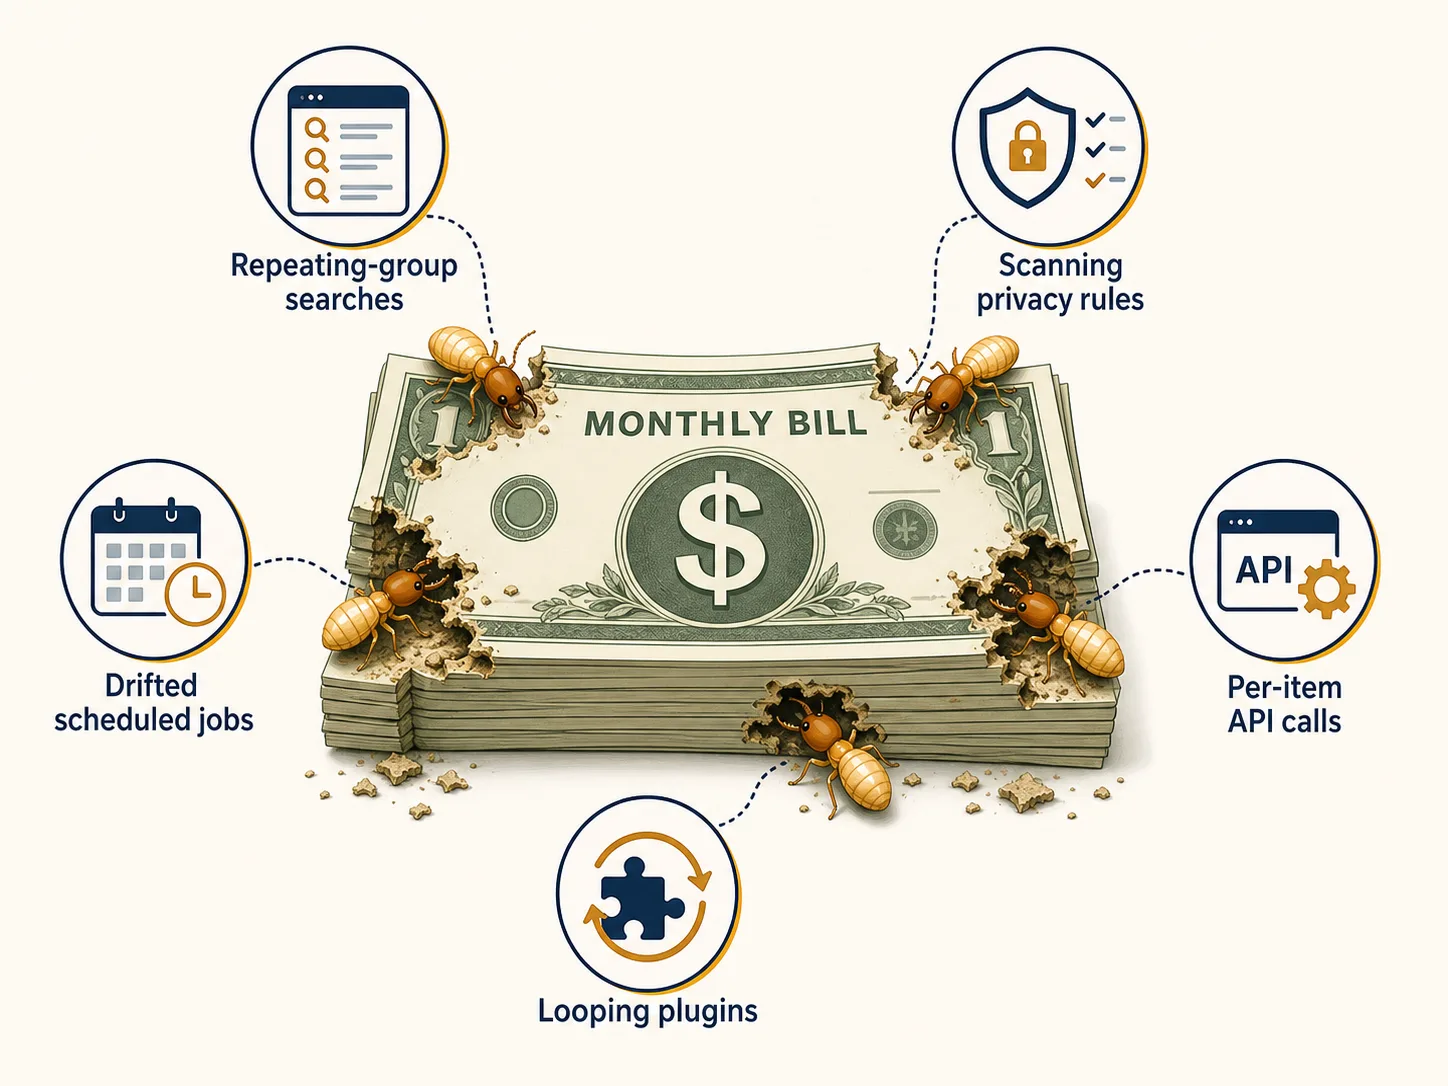
The Anti-Patterns That Eat Your Budget
The same five anti-patterns appear in nearly every expensive Bubble app. Each one looks innocent in isolation; each one compounds with scale.
Anti-Pattern 1 — Repeating Group With "Do a Search for" as Data Source
A repeating group bound directly to a "Do a search for" expression re-runs the search every time the group renders, including on filter changes, sort changes, and pagination. The fix is to perform a single search, store the result in a custom state, and bind the repeating group to the state. This single change is the most common WU win we see, and it usually moves the needle materially on page-load cost.
Anti-Pattern 2 — Nested Privacy Rules That Scan
Privacy rules act as query filters on every database search, and rules that have to evaluate cross-type conditions ("show this record only if the current user's team's plan is active and not archived") force Bubble's runtime to do additional joins on every read. Flattening privacy logic — pre-computing role flags, denormalizing where appropriate — reduces per-search cost across every page that touches the affected types.
Anti-Pattern 3 — Scheduled Workflow That Touches the Wrong Data Set
Most teams set up a scheduled workflow during development and never re-audit it. As the dataset grows, the workflow's per-execution cost grows with it — frequently with no corresponding business benefit. The fix is a quarterly review: every scheduled workflow needs a current justification, a current data-volume bound, and a current owner.
Anti-Pattern 4 — API Connector Call Inside a Per-Item Workflow
An API call placed inside a per-item recursive workflow executes once per list item. For a small list this is fine. For a 5,000-item list this is fifty thousand API calls (counting retries) plus per-call WU charges. Where the external service supports a bulk endpoint, switch to it; where it does not, batch into chunks and rate-limit.
Anti-Pattern 5 — Custom Plugin That Calls Bubble's Server in a Loop
Some marketplace plugins make repeated server-side calls on the user's behalf — for example, an enrichment plugin that calls an external API on every page load. The plugin's WU cost looks like normal page-load activity in the bill but is actually plugin-attributable. Removing the plugin is the only durable fix; sometimes the dependency you accumulated is the cause.
From Bill to Action — Optimization vs Migration
The point of reading the bill is not to feel bad about the number. It is to make a decision. Two paths fork off the same analysis.
Path A — Optimize and Stay
If your top consumers are concentrated in one or two anti-patterns and your data volume is modest, optimization typically buys you twelve or more months of additional runway on your current plan. The first round commonly delivers material WU reduction with a few days of work; the second round runs into diminishing returns. As long as the savings extend your runway by at least a year, optimization is the cheaper path.
Path B — Plan a Migration
If your top consumers are structural (the same anti-pattern repeated across many surfaces), or if optimization only buys you a few months before the next overage, the math flips. Migration is a one-time investment that replaces variable WU exposure with predictable, code-controllable infrastructure. The tipping-point math is in our workload-units guide; the practical first step is an architecture audit, not code.
The Decision Rubric
| Signal in the Bill | Optimization Path | Migration Path |
|---|---|---|
| Top 3 consumers concentrated in 1-2 anti-patterns | ✅ Tackle the patterns first | — |
| Anti-patterns repeated across many surfaces | — | ✅ Structural — migration likely cheaper long-term |
| WU growth tracks user growth | ✅ Healthy — optimize the steepest curves | — |
| WU grows faster than user count for 2+ months | — | ✅ Compounding cost curve — start migration planning |
| Overage as a recurring monthly line item | — | ✅ The plan tier no longer fits the app |
| Total spend < migration break-even window | ✅ Stay until economics flip | — |
Build a Monthly WU Audit Routine
The bill becomes a strategic document only when you read it on a schedule. A thirty-minute monthly routine catches every important pattern before it compounds.
The Monthly Loop
- Snapshot the bill — record the total, the overage if any, and the breakdown by category visible on the billing page.
- Run the profiler over a representative day — list the top ten consumers with per-execution cost and frequency.
- Compare to last month's snapshot — flag any line item that grew more than meaningfully without a known cause.
- Pick one fix and one watch — one optimization to ship this month, one trend to monitor next month.
- Update your team doc — a single rolling document recording each month's snapshot, fix, and watch is more valuable than any individual analysis.
Quarterly Decision Review
Once per quarter, lift the bill from a tactical artifact to a strategic one. Compare your last three months of snapshots to your runway, your hiring plan, and your go-to-market commitments. If your Bubble cost curve is trending into territory that does not fit your business model, that is the quarter where the optimize-vs-migrate decision deserves a real meeting — not a one-line Slack message.
Frequently Asked Questions
Q. Where exactly do I find my workload-unit usage in Bubble?
The billing page at the top of your app's Settings shows the running total and overages. The per-workflow detail lives in Settings → Logs → Server logs once the WU profiler is enabled in app settings. Together they give you the score and the breakdown.
Q. Why is my WU bill higher this month if I did not change anything?
The single most common cause is a scheduled or recursive workflow whose data set has grown — its per-execution cost rises with the data, even with constant user activity. The next most common cause is a marketing or seasonal traffic bump. The profiler will tell you which.
Q. Can I set a hard spending cap on Bubble?
No. Bubble auto-charges overages with no spending cap, no alert threshold, and no approval gate. The only way to bound exposure is to monitor the bill on a routine, optimize the largest consumers, and downgrade plan tiers carefully if usage drops — and even that is reactive, not preventive.
Q. How much can optimization actually save?
Apps that have never been audited commonly find a meaningful first-round saving from one or two changes — replacing repeating-group searches with cached states, lengthening scheduled-workflow intervals, or batching API calls. The second round runs into diminishing returns. If your savings only buy a few months of runway, that signals the optimization ceiling rather than a quick win.
Q. When does the bill say "migrate" rather than "optimize"?
When your top consumers are structural (the same anti-pattern repeated across many surfaces), when WU growth outpaces user growth for two or more consecutive months, when overage becomes a recurring monthly line item, and when optimization rounds only buy a few months of runway each. A combination of these signals is the standard inflection point.
Q. Do I need a developer to read my WU bill?
No. The billing page and profiler are designed to be read by the same people who built the app. A non-technical founder can run the monthly audit routine in this article without engineering help. A developer becomes valuable when you decide to act on the analysis — particularly when the action is migration planning rather than incremental optimization.
The Bill Is a Conversation, Not a Verdict
- The bill is six drivers, not one number: page loads, database searches, workflow actions, API calls, scheduled workflows, and recursive workflows each scale differently. Knowing which dominates yours is the start of every optimization or migration plan.
- The profiler is your most under-used tool: a thirty-minute pass over a representative day surfaces the top ten consumers, and most apps have a small number of workflows accounting for the majority of cost.
- Five anti-patterns explain most surprises: repeating-group searches, scanning privacy rules, drifted scheduled jobs, per-item API calls, and looping plugins. Each one is fixable; the structural ones may be the migration signal.
- Two paths fork from the same bill: optimize-and-stay when the wins extend runway by a year or more, plan-to-migrate when optimization plateaus or growth outpaces it. The decision is not personal; it is what the numbers say.
- Read monthly, decide quarterly: a routine turns invoices into intelligence. Without the routine, you find out about cost problems on the day they become urgent.
The bill is not a verdict. It is a conversation between your app and your business — and you can only have the conversation if you know how to read what it is saying.
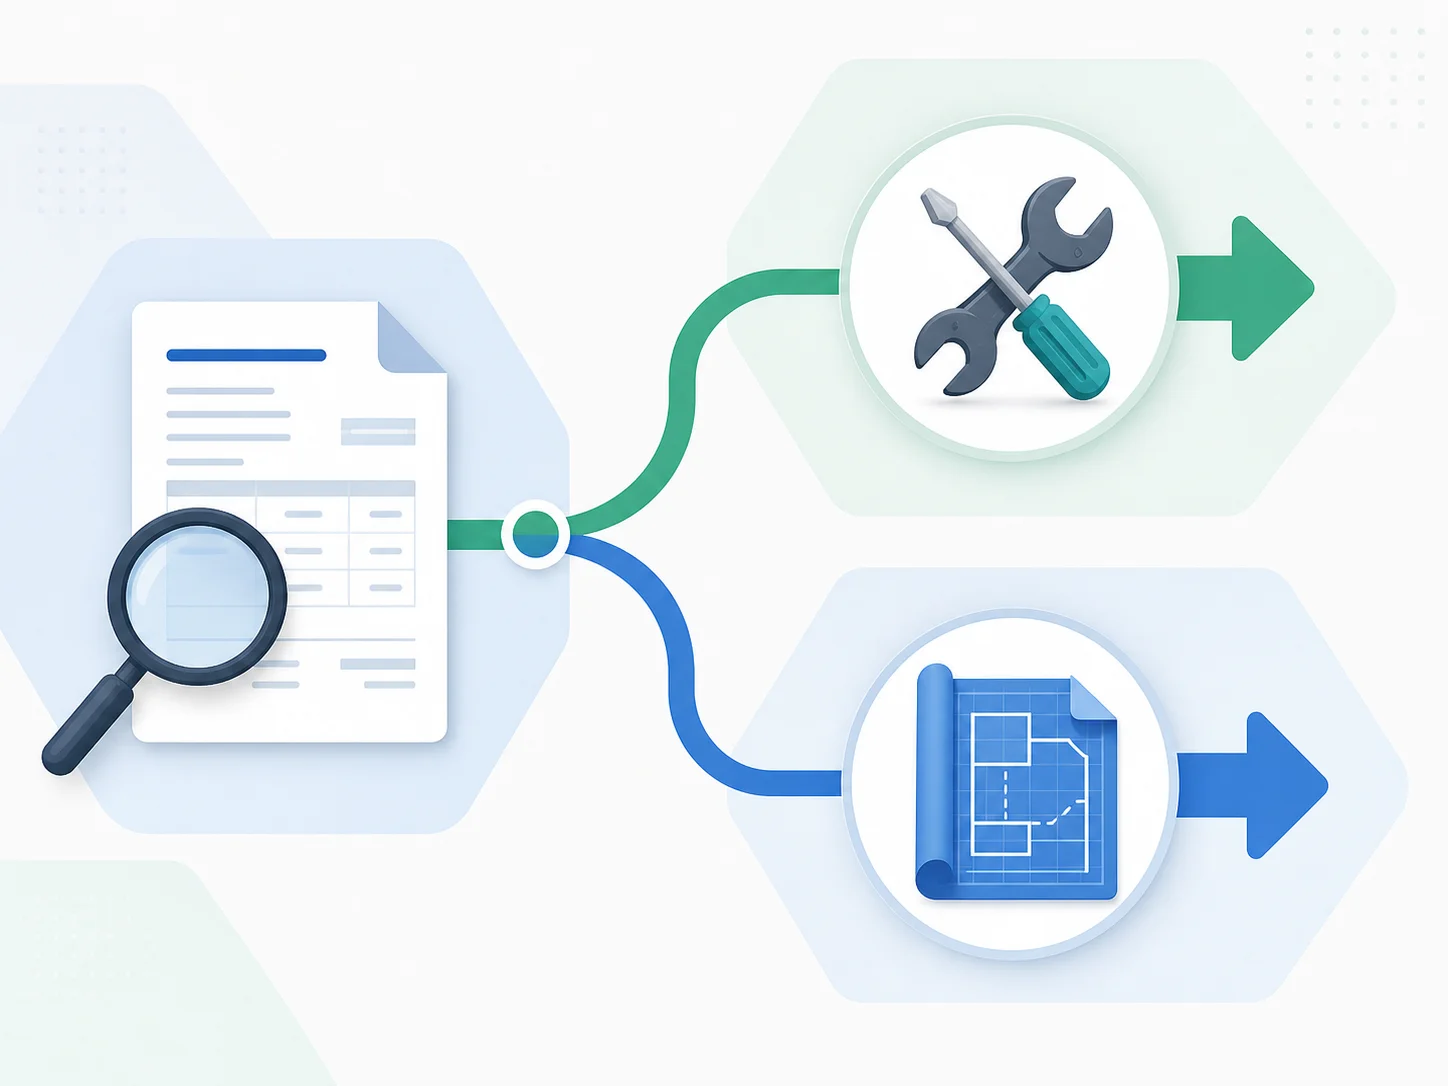
Make the Bill Actionable in Minutes
Read your bill, then read your architecture. Extract every data type, API connector, backend workflow, and app setting into a developer-ready blueprint — the artifact that powers both optimization and migration paths.
Scan My App — FreeHow Complex Is Your Bubble App?
Find out in minutes. Relis automatically extracts and documents your entire Bubble architecture — data types, APIs, workflows, and settings.
How Complex Is Your Bubble App?
Find out in minutes. Relis automatically extracts and documents your entire Bubble architecture — data types, APIs, workflows, and settings.