We Analyzed Bubble Apps. Here's What Migration Really Costs.
Three agencies quote 3x apart for the same Bubble app. We analyze the architecture variables that actually drive migration cost — and what gets ignored.
20 min read
Migration teams quote Bubble.io projects every week, and the quotes for the same app — same screens, same demo, same product walkthrough — routinely span a factor of three. For example, imagine three quotes of around $18K, $35K, and $55K against the same app, with timelines of roughly eight, fourteen, and twenty weeks. Each agency is competent. None is overcharging. They are looking at the same surface and producing different numbers because the surface is not what determines cost.
From the Bubble apps we have audited at Relis — extracting their full architecture into structured documentation across data structure, API integrations, backend workflows, and app settings — a small set of variables consistently explains most of the spread between low and high quotes. Most of those variables are invisible during a normal product demo. They live behind menus, inside backend tabs, in the option-set configuration, and in the privacy rule sub-panels. The teams that scope only what is visible produce optimistic numbers that the project then breaks during implementation.
This article walks through what we see when we look at the inside of a Bubble app for cost-estimation purposes. It is not a quote calculator — that requires a real audit, not an article. It is the framework you can carry into a conversation with your own developer or vendor so the number you get back reflects the work that actually exists rather than the work that is visible from a demo.
Why the Same App Gets Three Different Quotes
The standard scoping process is broken in a specific, repeatable way. An estimator joins a thirty-minute demo, watches the app run through three or four user flows, asks about user counts and key integrations, and goes home to write a number. The number reflects what they saw. The work reflects what is there. The two are not the same thing.
The Surface Is Not the System
A Bubble app shows you pages. The pages are real. They imply UI work, responsive layout, state handling, and component reuse decisions in the new stack. But pages are roughly proportional to a coefficient that varies by less than 2x across most apps in the apps we have audited. The variables that vary by 5x or 10x — number of backend workflows, depth of conditional branching, count and criticality of API integrations, and the density of privacy rules — do not appear in the demo. They appear when you open the editor's "Backend workflows" tab, the API Connector configuration panel, and the privacy sub-tab on each data type.
Why Three Estimators Disagree
Disagreement between estimators is not a sign that one of them is wrong. It is a sign that they each surveyed a different subset of the application. The estimator who clicked into the Backend workflows tab counts thirty workflows. The one who did not assumes the standard "ten workflows" pattern that fits a typical screen-flow demo. Multiplied by an hourly rate, that gap alone produces tens of thousands of dollars of difference.
- The depth of any single backend workflow (a "send-email" workflow may contain twelve nested actions)
- Whether scheduled workflows run continuously and require background-job infrastructure
- Privacy rule complexity that turns a single search into a multi-table evaluation
- Option Sets used as configuration that need to become enums or seeded reference tables
- App settings — Stripe, email, domain, redirects, SEO — that are migration work but read like "checkbox items"
The result is the 3x quote spread. It is not a pricing problem. It is a measurement problem.
What We Look At When We Audit a Bubble App
When we extract a Bubble app for documentation, we walk through four extraction categories that map onto the four layers of any non-trivial Bubble app. The breakdown is the basis of how we think about migration cost: each layer carries its own translation work, and together they form the surface area of the project.
Layer 1 — Data Structure
Data types, fields, field types (including the nuanced ones — lists of references, geo-locations, file uploads), and the relationships between types. This layer is mostly visible from the Data tab, but the privacy rules attached to each type are not, and they tend to be the part that translates into the most authorization code. We covered the model in detail in our breakdown of the four architecture layers a Bubble migration team must audit.
Layer 2 — API Integrations
Every entry under API Connector and every plugin that uses an API key. Not just "Stripe" or "OpenAI" as line items, but the actual call surface: which endpoints, which auth method, which response shape, which retry pattern, which webhook handlers exist on the Bubble side. This is the layer most likely to be missed in a fast scoping session. The depth of an integration matters at least as much as its name — see our guide to migrating Bubble API Connector configurations.
Layer 3 — Backend Workflows
The single biggest source of variance in cost across Bubble apps in our audits. Backend workflows are invisible in the running app, often invisible in the demo, and frequently the bulk of the actual logic. Their translation to code is described in our backend workflows to background jobs translation guide.
Layer 4 — App Settings
Domain configuration, SEO metadata, privacy and cookie settings, billing integration plumbing, custom redirects, page-level transitions, and the various sub-tabs nobody opens during a demo. None of these get implemented for free in the new stack. They tend to get bundled into a "miscellaneous" line item that is invariably underestimated.
Four Variables That Explain Most of the Spread
From the apps we have looked at, four variables explain the bulk of cost variance. They are not equally weighted in any single project, but as a group they capture the spread that pure feature-counting misses. Two of the four are nearly invisible during scoping; one is partially visible; only the last shows up clearly in a demo.
Variable 1: Workflow Depth and Branching
This is the single largest driver in our experience. Workflow count alone is a poor proxy because depth varies enormously: a workflow with three linear actions is straightforward. A workflow with a dozen actions, several conditional branches, recursive list processing, and error-handling logic is a meaningful piece of state-machine engineering once translated to code. Apps that look "small" in screen count can have backend workflow density that pushes them into a higher cost band.
Variable 2: Data Relationship Complexity
Bubble's data model permits patterns — lists of references, circular relationships, denormalized structures created to work around privacy-rule performance — that map into significant relational schema design work. A clean star-shaped schema with one-to-many relationships migrates faster than a tangled graph of list fields and circular references. The number of types is not the right proxy. The shape of the relationships is.
Variable 3: Integration Count and Criticality
API integrations matter not because there are many of them but because the critical ones (payments, auth, transactional email) come with non-trivial state management — webhook handlers, idempotency, retry logic, lifecycle events. A single Stripe subscription integration with proper webhook handling is more work than five "fetch a list of items" integrations combined. We treat criticality as a multiplier on count rather than a flat per-integration line item.
Variable 4: Cutover Constraints
How much downtime can the business tolerate? A weekend cutover with planned downtime is the cheapest path. A zero-downtime migration with parallel systems, gradual traffic shifting, and real-time data sync between the legacy Bubble instance and the new stack can effectively double the testing and infrastructure budget. This is not a function of the app — it is a function of business constraints — but it is the variable that most often distinguishes a $35K project from a $70K project for the same architecture.
| Variable | Visibility in Demo | Effect on Cost | Where We Measure It |
|---|---|---|---|
| Workflow depth | Invisible | Largest single driver | Backend Workflows tab + per-workflow action counts |
| Data relationship complexity | Partial | Schema design + migration script effort | Data tab + field-type inspection (lists, references) |
| Integration count and criticality | Partial (criticality usually missed) | Multiplied by how revenue-critical each integration is | API Connector + plugin list + webhook handlers |
| Cutover constraints | Outside the app | Can roughly double infra and testing budget | Conversation with business owner, not the app |
Three Complexity Tiers, Three Cost Bands
Putting the variables together, the apps we have audited tend to fall into three loose tiers. The bands below describe what we observe; they are not a calculator and they are not a quote. Real quotes depend on local labor rates, agency overhead, and project scope decisions that are outside the architecture itself. Treat the bands as a sanity check on whether a quote you receive is in the right neighborhood for the architecture you have.
Small-Tier Apps
Roughly speaking, apps with a handful of data types, a small number of straightforward backend workflows, one or two integrations of moderate criticality, and a tolerance for weekend cutover. These apps tend to be MVPs and internal tools where Bubble was the right choice for v1 and the migration is driven by ownership, not capacity. Quotes in the low-five-figures range that some of the consultancy-published case studies report tend to land here. The cost driver is uniform engineering effort more than architecture surprise.
Medium-Tier Apps
The most common shape we see. Several dozen data types, a meaningful number of backend workflows including some scheduled or recursive ones, three to seven integrations with at least one revenue-critical (payments, auth, or both), and a moderate number of Option Sets. Privacy rules typically have at least one non-trivial role-based pattern. Cutover preferences vary. Migration quotes for this tier span a range we have seen quoted in published case studies as the "$25K–$45K" band, but with significant tilt within that range based on workflow density. The variance inside the band is itself driven by the four variables above.
Large-Tier Apps
Apps with extensive backend logic — many workflows, deep branching, recursive list processing — and several integrations with stringent reliability requirements. Cutover often demands zero downtime. These apps tend to live in B2B SaaS or fintech contexts where the Bubble app outgrew Bubble's WU pricing model and the engineering work simply has to happen. Quotes here run into the high five figures and into six figures, particularly when zero-downtime cutover is required. We covered the cost mechanics of this tier in our framework on how architecture complexity drives Bubble migration cost.
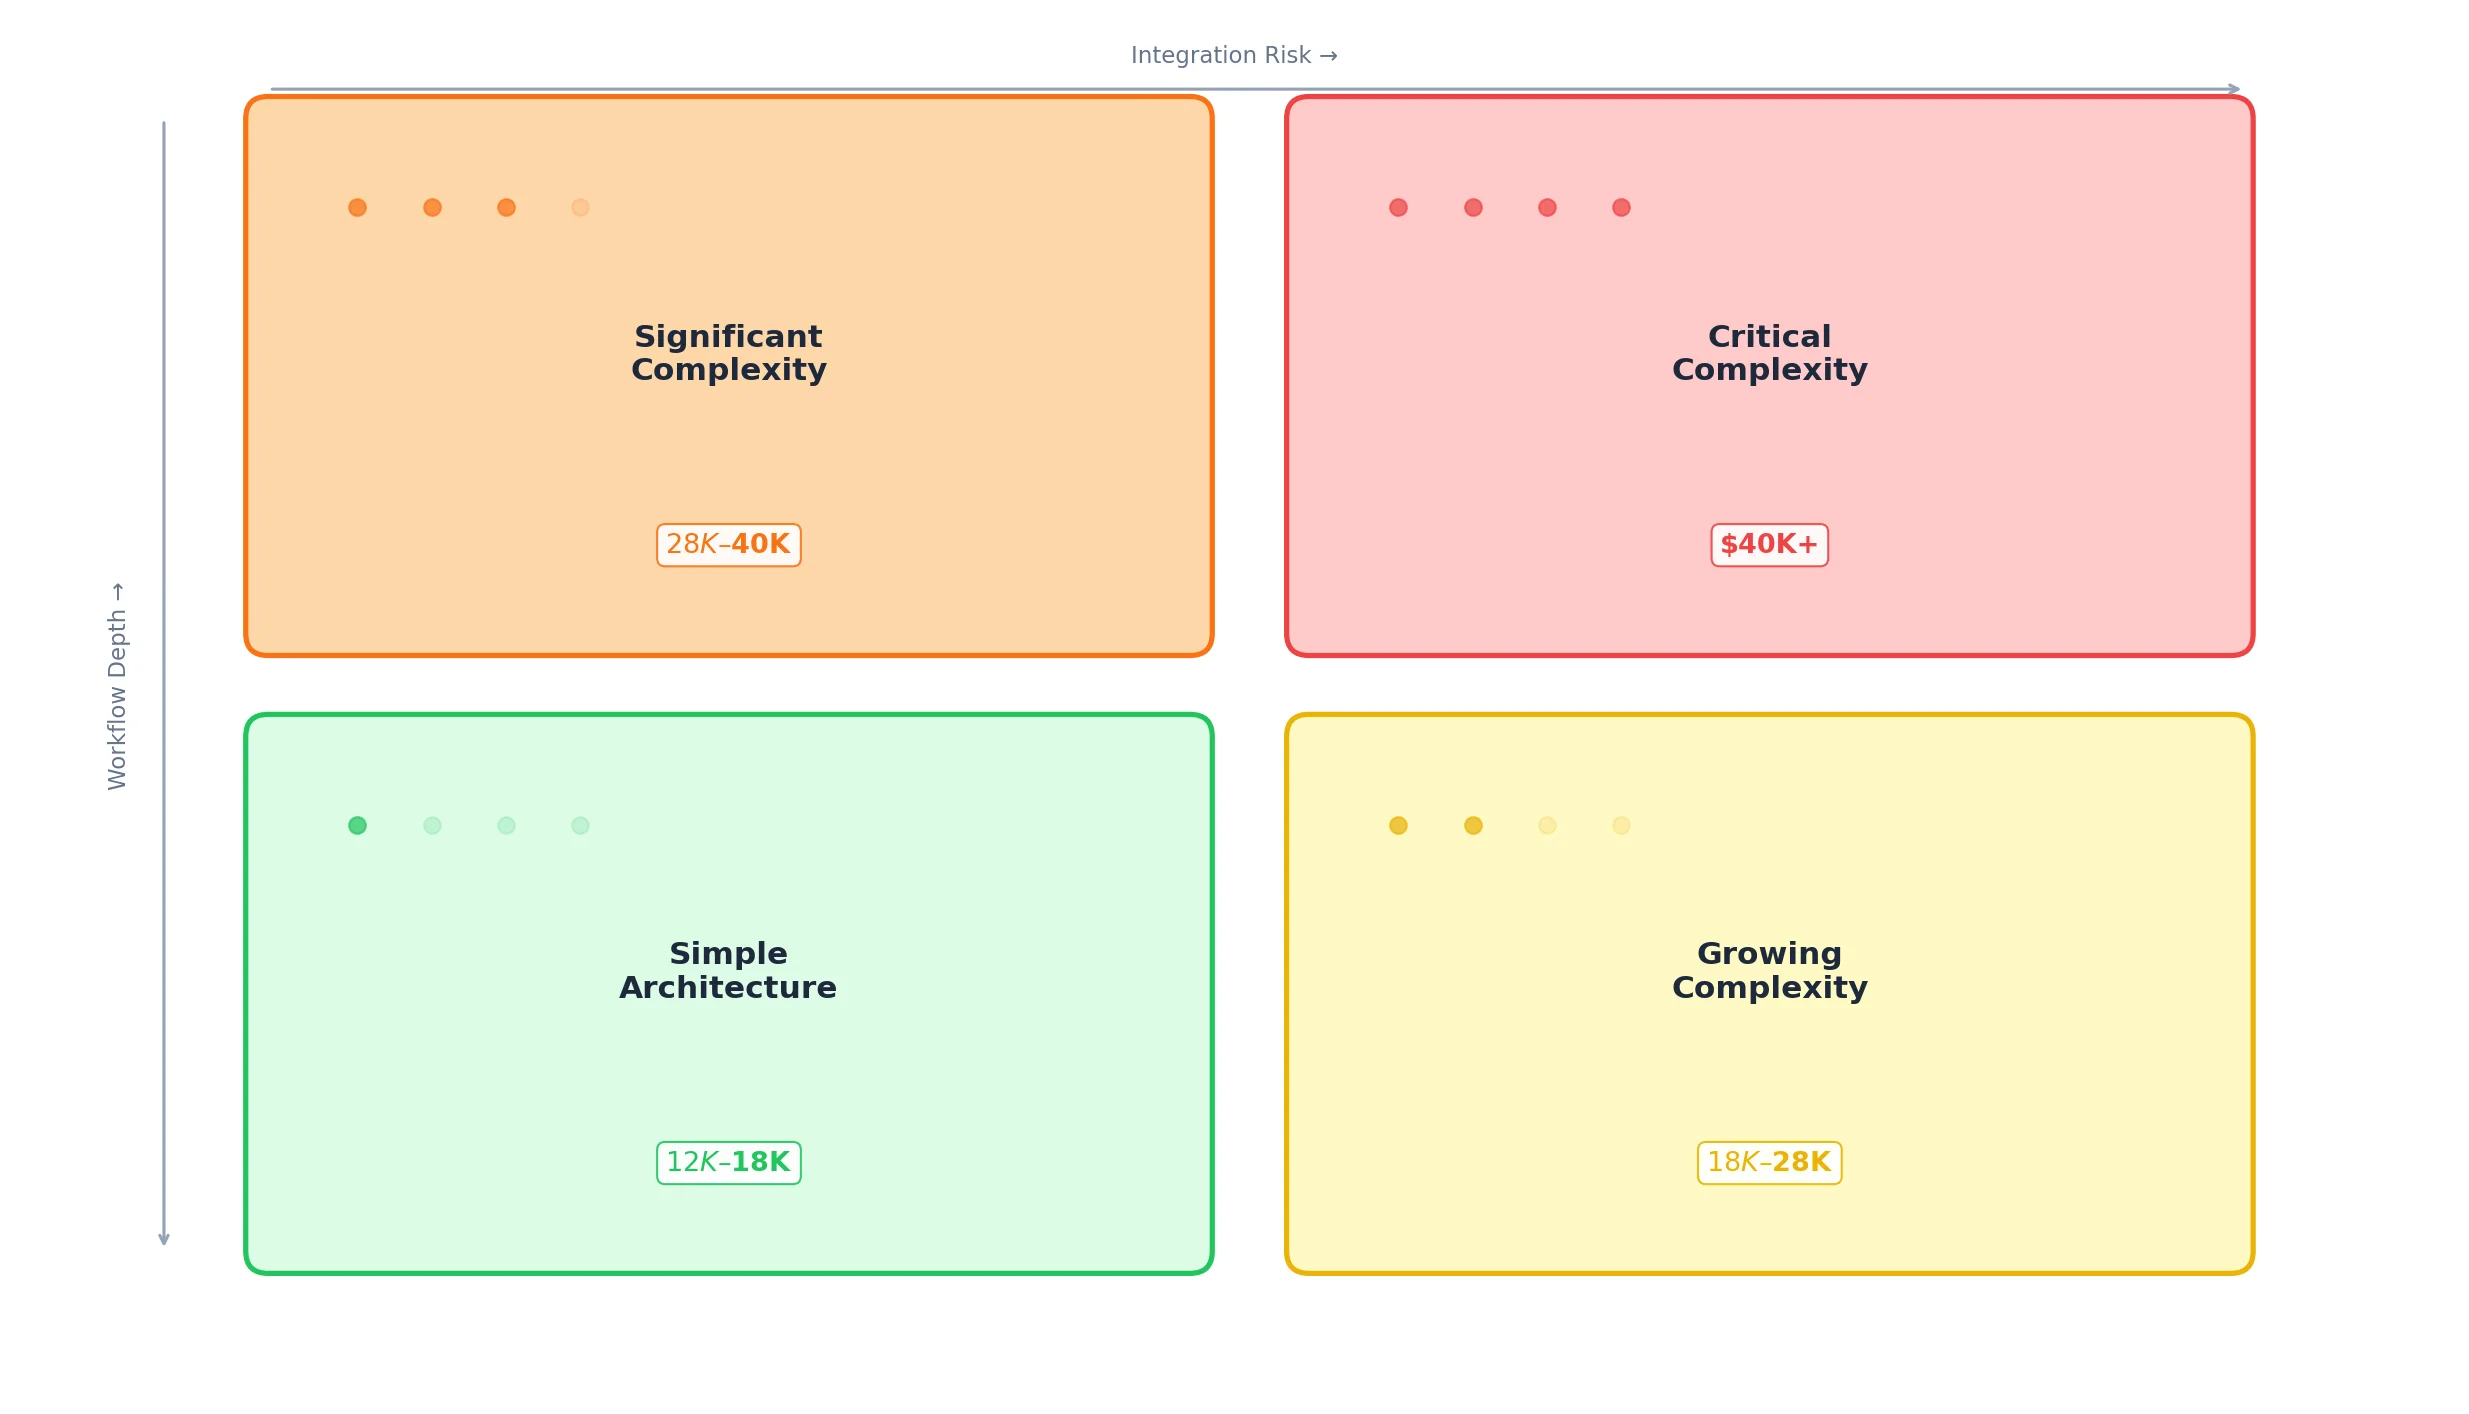
The cost ranges we describe here reflect patterns we have seen in publicly reported case studies and in the architecture profiles of the apps we have extracted. They are not the result of a market survey, and they do not substitute for a real quote based on a real audit. Treat them as the rough shape of the distribution, not as a price list.
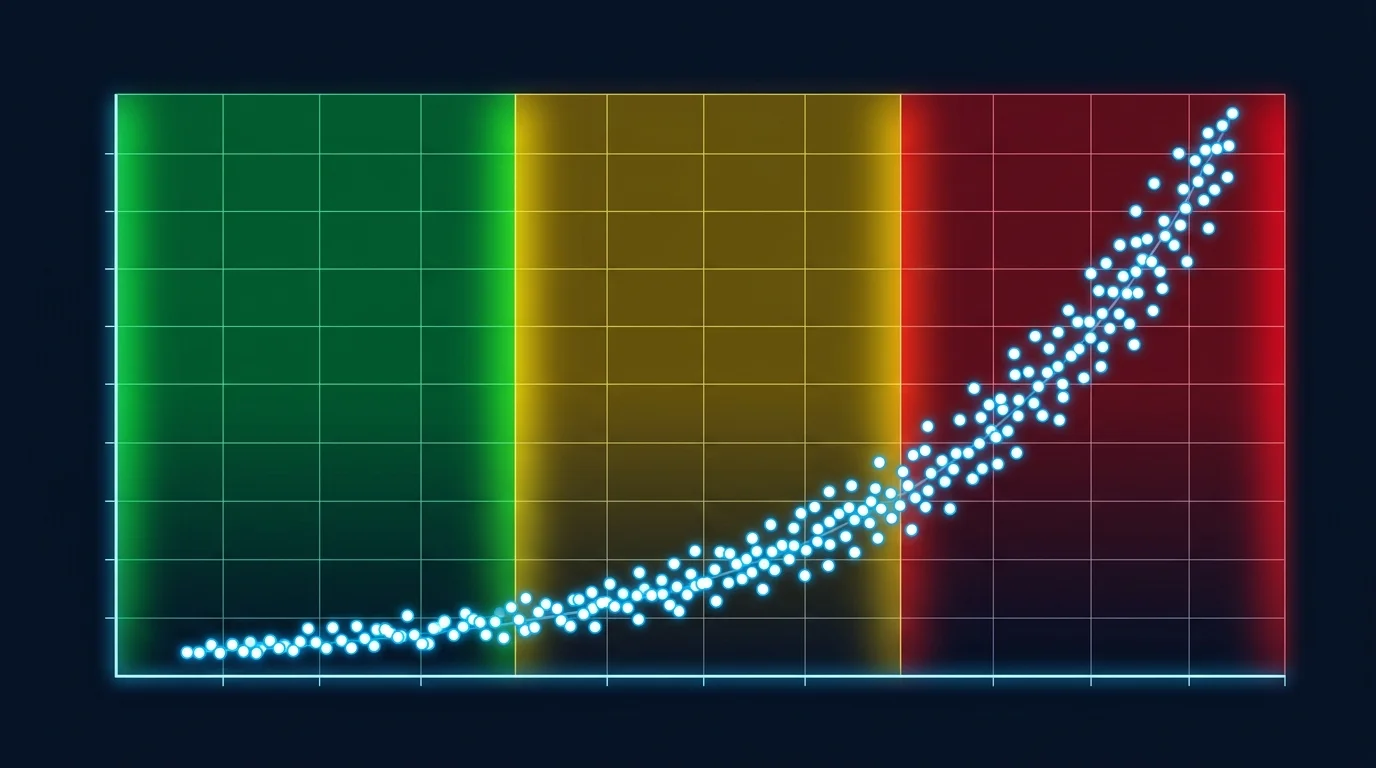
Why Headline Numbers Mislead
"The average Bubble migration costs X" is a sentence that crops up in vendor marketing and in podcast interviews. It is technically true and operationally useless, because the distribution of migration costs is not a normal curve. It is skewed by a small number of large-tier projects on the right tail and weighted heavily by medium-tier projects in the middle. An average reflects a project that very few real apps actually resemble.
Median Beats Average
For the same reason that headline house prices use medians, anyone giving guidance on Bubble migration cost should be using a median or a tier-specific band rather than an average. The median better describes the typical app's migration cost. The average is pulled toward the high tail by a handful of large projects whose architecture is genuinely an outlier and which therefore should not anchor expectations for a typical migration.
"My App Is Simple" Is Usually Wrong
One of the most consistent observations we make during extraction is that the owner's mental model of their app's complexity is not aligned with the architecture's actual complexity. Apps that owners describe as "simple" routinely contain dozens of backend workflows, several non-trivial integrations, and privacy rule structures that took the original builders years of incremental decisions to construct. The owner is not wrong about the user experience being simple. They are wrong about the implementation being simple — because the simplicity of the user experience is built on top of, not in place of, the underlying complexity.
Quotes Should Reflect Architecture, Not Vibes
The teams that get accurate quotes are the ones that have a measurement of their architecture in hand before they ask for them. A short call where the owner can answer "we have N data types, M workflows of which K are scheduled, P integrations of which Q are revenue-critical" — backed by an actual extracted document — eliminates the largest single source of estimator disagreement. The estimator no longer has to guess at the invisible variables. They can scope the work, not the demo.
- Workflow count, separated into one-shot, scheduled, and recursive
- Integration count, with criticality flagged (payments, auth, transactional email)
- Privacy rule count, with role complexity flagged (single-role vs multi-role conditional)
Position Your App Before You Ask for Quotes
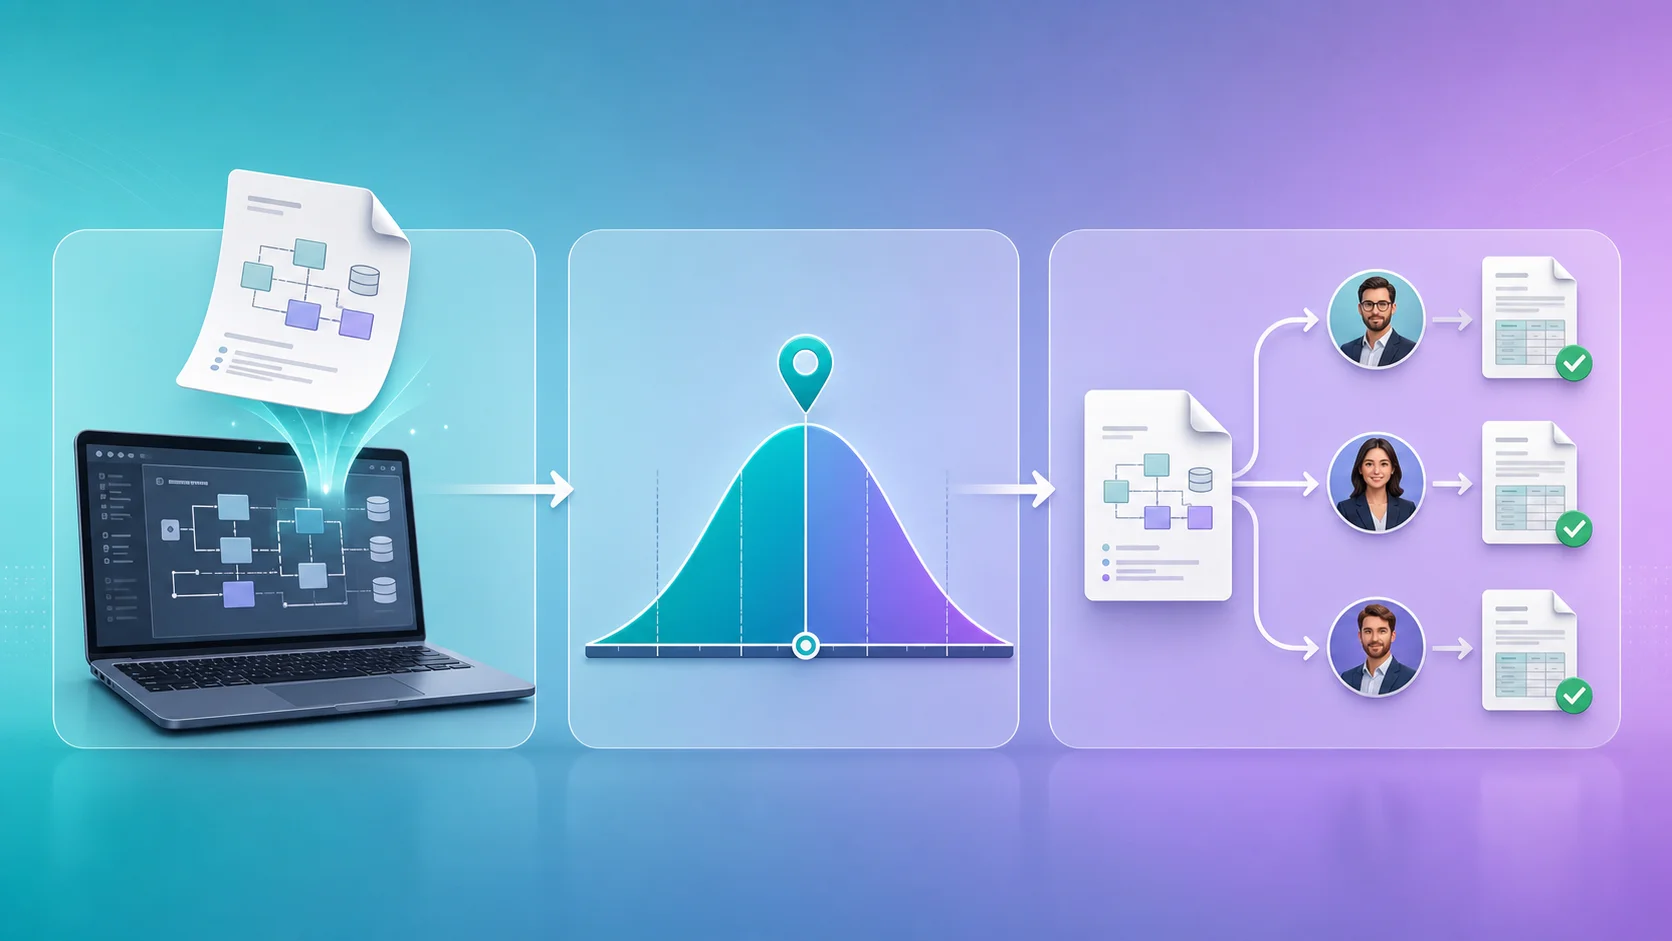
The single most actionable thing an app owner can do before requesting migration quotes is to obtain a structured audit of their own architecture. Not a feature list. Not a screen tour. A document that names the four layers and counts the variables that drive cost.
Step 1 — Extract the Architecture
Whether by spending a few engineer-days walking the editor manually or by using a tool that automates the walk, the goal is a single document that lists data types and their fields, every API Connector entry with its endpoints, every backend workflow with its action count, and every app-level setting that needs to be carried over. Relis produces this set across nine document types in a few minutes; a thorough manual audit measures in days.
Step 2 — Locate Yourself on the Distribution
With the audit in hand, the four variables become countable. You may discover that what you described to vendors as a "small app" actually has the workflow density of a medium-tier app, which is a useful thing to know before you sign a fixed-price contract that assumed small-tier scope. Or you may discover the opposite — that what felt complex from the inside is straightforward by the variables that matter.
Step 3 — Send the Audit to Estimators
Sending the same architecture document to multiple estimators eliminates the largest source of quote variance. The remaining variance reflects local labor rates, agency overhead, and risk pricing — which are real differences worth comparing — rather than measurement disagreement, which is not. We compare the estimator-side outcomes with and without architecture documents in our breakdown of how to vet a Bubble migration agency.
Frequently Asked Questions
Q. Are the cost bands in this article based on a survey of agencies?
No. They reflect publicly reported case studies and the architecture profiles of the apps Relis has extracted. Treat them as the rough shape of the distribution, not as survey data. Real quotes always require a real audit.
Q. How can I tell which tier my app belongs to without a full audit?
Open the Backend workflows tab in the editor and count workflows. If you have fewer than ten, mostly linear, you are likely small-tier. Twenty to fifty with conditional branching is medium-tier. More than fifty, with scheduled and recursive workflows mixed in, is large-tier. Workflow depth and integration criticality refine the band further.
Q. Why does workflow depth dominate cost rather than page count?
Pages translate into UI work that scales fairly linearly with count and follows well-understood patterns in modern frameworks. Backend workflows translate into business logic, which scales with branching depth and side-effect count, and rarely follows well-understood patterns. The translation work per workflow is much more variable than per page.
Q. Should I optimize my Bubble app before migrating to lower the cost?
Optimization rarely lowers migration cost — the architecture you migrate is the same. Optimization can lower the operational cost of staying on Bubble, which sometimes shifts the migration timeline. We discuss the tradeoff in our piece on the Bubble Workload Units tipping point.
Q. What is the cheapest way to reduce quote variance across vendors?
Send all vendors the same architecture audit. The largest source of variance between vendors is measurement, not pricing. Eliminating measurement disagreement collapses the variance to the genuine pricing differences, which are smaller than people expect.
Q. Does the four-variable framework apply to migrations off other no-code platforms?
The variables themselves generalize — workflow depth, data complexity, integration criticality, cutover constraints — but the relative weights differ by platform. Bubble's particular cost driver is the invisible backend workflow tab. On other platforms the dominant invisible layer may be different.

Cost Is a Distribution, Not a Sticker Price
A Bubble migration does not have a price. It has a distribution. The width of that distribution is set by the architecture — workflow depth, data relationship complexity, integration criticality, cutover constraints — and by the local market for engineering labor. Where any individual app lands on the distribution is determined by the architecture, not the demo.
The 3x quote spread between agencies for the same app is not a pricing problem. It is a measurement problem. Three estimators looking at the same surface and producing different numbers means three different surveys of the application underneath the demo. Aligning them is the cheapest single thing an app owner can do to reduce the noise — by handing every estimator the same architecture document, you collapse the variance into the genuine pricing differences that are worth comparing.
The four variables in this article are not an attempt to replace the audit conversation. They are a way to understand which inputs into that conversation matter and which are noise. The question "how many pages do you have" is noise. The question "how many backend workflows do you have, of which how many are scheduled and how many are recursive" is signal. The teams that ask the second question produce the quotes that match the work that gets done.
Audit Your Architecture Before You Quote
Relis extracts your Bubble app's full architecture across all four layers — data, APIs, workflows, settings — into nine document types in minutes. Hand the same audit to every estimator and collapse the quote variance to the parts worth comparing.
Extract Your Architecture FreeHow Complex Is Your Bubble App?
Find out in minutes. Relis automatically extracts and documents your entire Bubble architecture — data types, APIs, workflows, and settings.
How Complex Is Your Bubble App?
Find out in minutes. Relis automatically extracts and documents your entire Bubble architecture — data types, APIs, workflows, and settings.