
Bubble App Performance Audit: Find Your Bottlenecks Before You Decide to Migrate
A structured framework for auditing Bubble.io app performance — measuring workload unit consumption, identifying the top 5 performance killers, benchmarking against migration triggers, and deciding whether to optimize or migrate based on data, not frustration.
16 min read
Every Bubble migration conversation starts the same way: "My app is slow." But slow is not a diagnosis — it is a symptom. And the treatment for a slow app built on architecture problems is very different from the treatment for a slow app hitting platform limits.
In our experience, a meaningful share of Bubble performance issues are fixable within the platform — an optimization pass that frequently makes the migration conversation premature. An optimization pass costs $5,000 to $15,000 and takes two to four weeks. A full migration costs $20,000 to $60,000 and takes eight to sixteen weeks. The audit framework in this guide tells you which path your app needs — and prevents you from spending 4x more than necessary on a problem that had a simpler solution.
Why You Need an Audit Before a Decision
The migration decision is emotional. You are frustrated with slow page loads, surprised by workload unit bills, and tempted by the promise of custom code performance. This frustration is valid — but it is not data. An audit replaces frustration with measurements, and measurements lead to better decisions.
What an Audit Reveals
A performance audit answers three questions: (1) Where specifically is the app slow — which pages, which workflows, which queries? (2) Why is it slow — architecture problems, data volume problems, or platform limits? (3) How much improvement is achievable without migration — 20%, 50%, 80%? The answers determine whether you optimize ($5K–$15K), go hybrid ($5K–$20K), or migrate ($20K–$60K).
The Cost of Skipping the Audit
Teams that skip the audit and jump to migration frequently discover, mid-rebuild, that the performance problem was a missing privacy rule or an inefficient search pattern — something fixable in an afternoon. They have already committed $20,000 and eight weeks to a migration that was not necessary. The audit costs $1,000 to $3,000 (or free with tooling) and takes two to five days. It is the cheapest insurance against a premature migration.
The Performance Measurement Framework
Measure performance across four dimensions. Each dimension has specific tools and benchmarks that separate architecture problems from platform limits.
| Dimension | What to Measure | Tool | Red Flag Threshold |
|---|---|---|---|
| Page Load Time | Time to interactive for key pages | Chrome DevTools, Lighthouse | Above 5 seconds consistently |
| Workload Unit Consumption | WU usage by operation type | Bubble Logs tab, WU meter | Above 80% of plan allocation |
| API Response Time | Backend workflow and API call latency | Bubble Server Logs | Above 2 seconds per call |
| Database Query Performance | Search operations and data loading | Bubble Debugger, performance profiler | Complex searches above 3 seconds |
How to Measure Page Load Time
Open Chrome DevTools (F12), go to the Network tab, and hard-refresh each key page (Ctrl+Shift+R). Record the total load time and the number of requests. Repeat three times and average. Focus on the pages your users hit most frequently — the dashboard, the main list view, the detail page. A Bubble app with properly optimized architecture should load most pages in 2 to 3 seconds. Pages above 5 seconds have optimization opportunities.
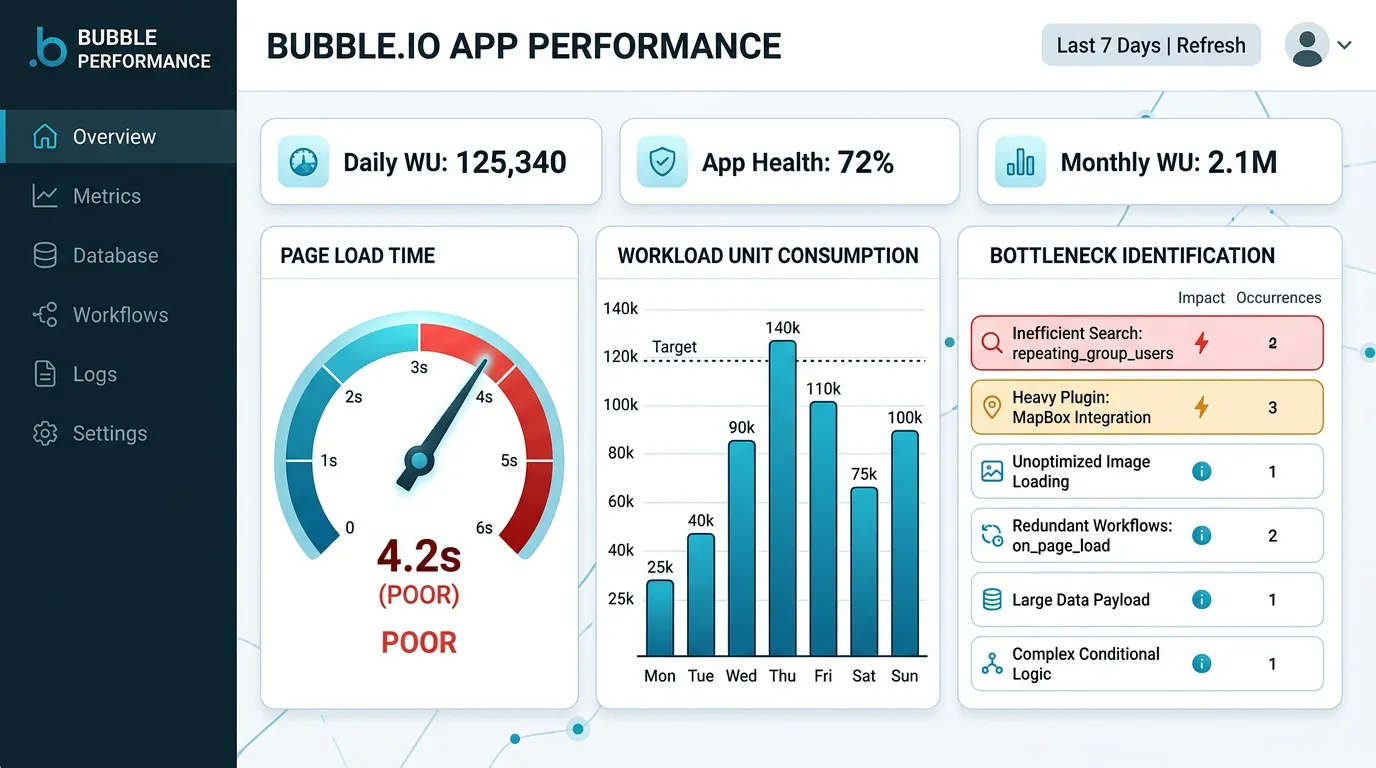
How to Measure Workload Unit Consumption
In Bubble's editor, go to Logs → Server Logs. Filter by date range (last 7 days) and review: total WU consumed, WU per operation type (search, create, modify, API call), and the top 10 most expensive operations. The WU meter in the app settings shows your consumption relative to plan allocation. If you are consistently above 80 percent, you are either approaching a plan upgrade or approaching a migration trigger.
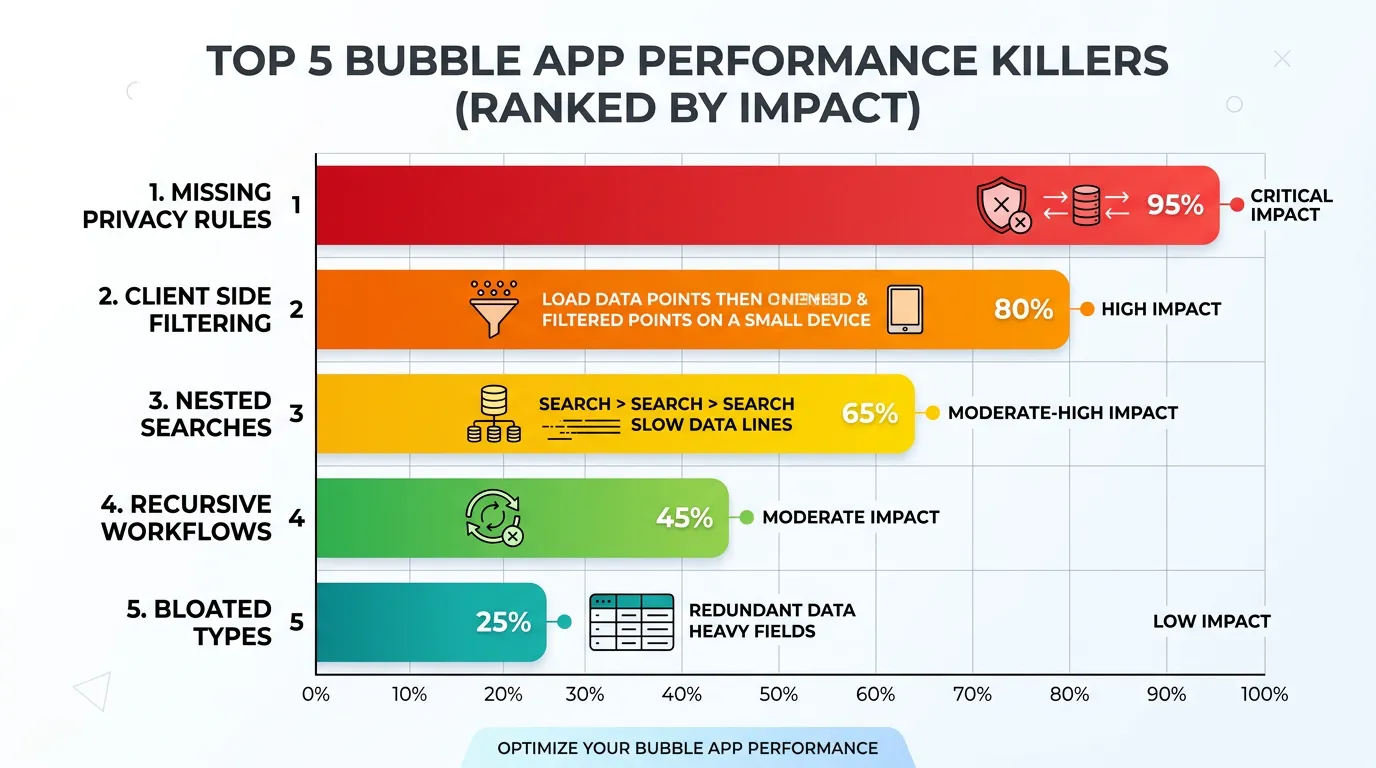
The Five Performance Killers in Bubble Apps
Across the Bubble apps we have audited and the patterns documented in published optimization guides, five recurring patterns account for the majority of performance problems. Each has a specific fix that can be implemented without migration.
Killer 1: Missing Privacy Rules
This is the number one performance killer. When a data type has no privacy rules, Bubble evaluates access for every record on every request. Adding targeted privacy rules — even simple ones like "Creator is Current User" — can double page load speed instantly because Bubble's query engine uses privacy rules to narrow the search scope before executing the query.
Killer 2: Client-Side Filtering Instead of Server-Side Search
Using :filtered on repeating groups loads all records to the browser, then filters client-side. With 10,000 records, this loads 10,000 records just to display 20. Replace :filtered with server-side search constraints (Do a Search for → with constraints). This reduces data transfer by an order of magnitude for large datasets.
Killer 3: Nested Searches in Repeating Groups
A repeating group showing Projects, where each cell runs "Do a Search for Tasks where Project = Current Cell's Project." If you have 50 projects, this fires 50 separate database queries — the N+1 query problem. Solution: restructure the data model to avoid nested searches, or use a satellite data type that pre-aggregates the needed information.
Killer 4: Recursive Workflows Instead of SAWOL
Recursive workflows (a workflow that triggers itself for each item in a list) are the most expensive operation in Bubble. Each recursion consumes workload units at the full single-operation rate. SAWOL (Schedule API Workflow on a List) processes lists at approximately 0.1 WU per item per Bubble's published WU guide — typically about an order of magnitude cheaper than equivalent recursion. Replace every recursive workflow with SAWOL unless the operation requires strict sequential processing.
Killer 5: Bloated Data Types
A User type with 40 fields loads all 40 fields every time any page accesses a User record — even if the page only needs the name and avatar. Solution: create satellite data types. A UserSummary type with only name, avatar, and role provides the list-display data without loading the full User object. This reduces data transfer by 60 to 80 percent for list pages.
- Add privacy rules to every data type — even "public" types benefit from explicit rules
- Replace every
:filteredwith server-side search constraints - Eliminate nested "Do a Search For" inside repeating groups
- Replace recursive workflows with SAWOL patterns
- Create satellite types for list displays (name, avatar, status only)

Workload Unit Forensics: Where Your WUs Actually Go
Workload units are Bubble's billing currency. Understanding where they go is the first step to reducing your bill — and determining whether migration is financially justified.
The WU Breakdown
In a typical Bubble app, WU consumption breaks down approximately as:
| Operation | WU per Operation | Typical Share of Total | Optimization Potential |
|---|---|---|---|
| Page loads (data fetching) | 0.5–5.0 | 40–50% | High (search optimization, satellite types) |
| Backend workflows | 1.0–10.0 | 20–30% | Medium (SAWOL, consolidation) |
| API calls (inbound/outbound) | 0.5–3.0 | 10–20% | Low (depends on usage pattern) |
| Search operations | 0.2–2.0 | 10–15% | High (constraint optimization, indexing) |
| File operations | 0.5–1.0 | 5–10% | Low (compression, lazy loading) |
Finding Your Top Consumers
In Bubble's Server Logs, sort operations by WU consumption. The top 10 most expensive operations typically account for 70 to 80 percent of total WU usage. These are your optimization targets. A single inefficient search that runs on every page load might consume more WUs than all your backend workflows combined. Fix the top 3 consumers and you might cut your WU bill in half.

The Optimization Ceiling: When Fixes Stop Working
Optimization has limits. After implementing all five fixes and restructuring your data architecture, you will reach a point where further optimization produces diminishing returns. This is the optimization ceiling — and it is the signal that migration becomes the rational choice.
Signs You Have Hit the Ceiling
- Optimized pages still load above 3 seconds: You have addressed all architecture problems and the platform itself is the bottleneck
- WU costs exceed $500/month after optimization: Your usage volume exceeds what Bubble's pricing model can serve cost-effectively
- You cannot add features without degrading performance: Every new feature makes existing features slower — a sign of platform-level resource contention
- Your user base exceeds 5,000 DAU: Bubble's infrastructure handles this volume but with noticeable latency — custom code eliminates it
There is a point where continued optimization on Bubble costs more in developer time than the migration would cost. If you have spent $10,000 on optimization passes and performance is still inadequate, the next $10,000 should go toward migration, not more optimization. The optimization ceiling is real — recognize it and pivot.
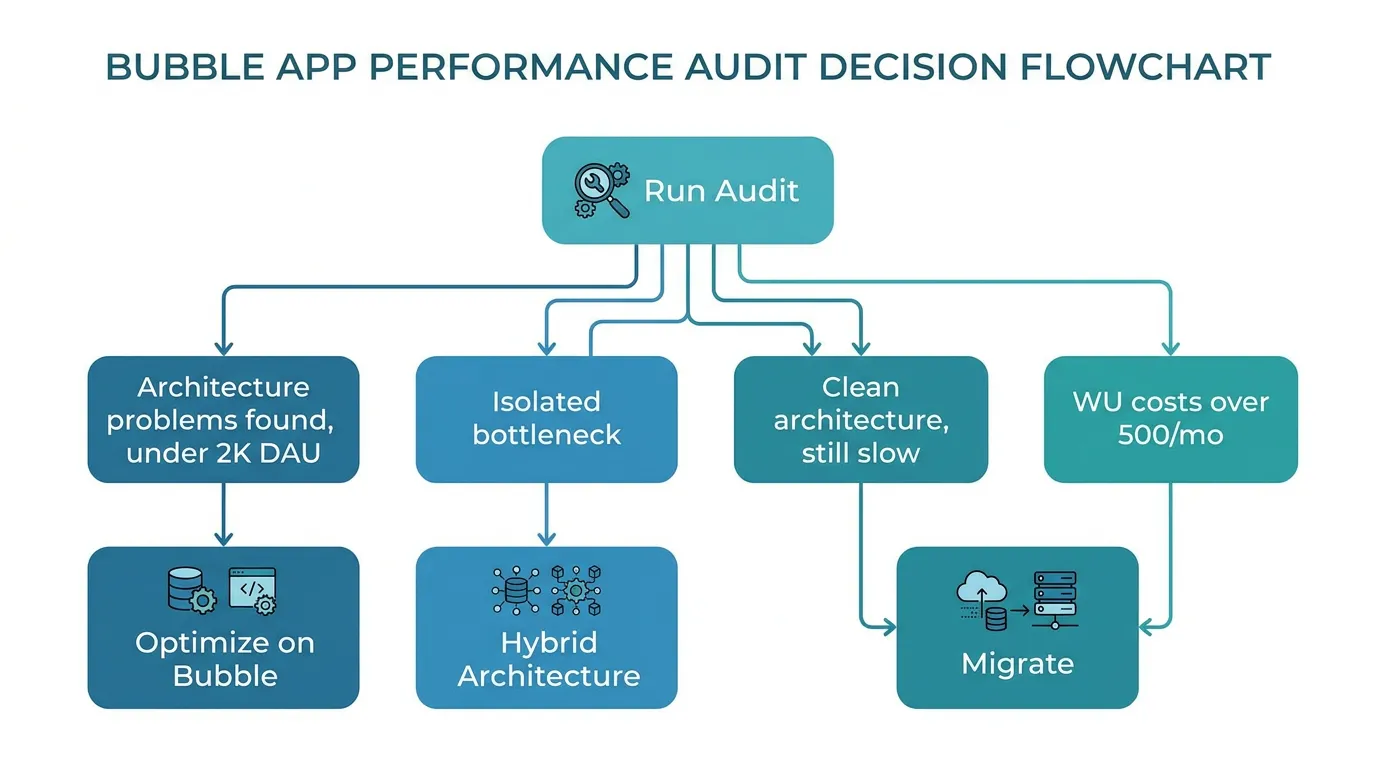
Benchmark Your App: Optimize, Hybrid, or Migrate
Use your audit results to place your app in one of three categories. Each category has a clear action plan and budget range.
| Audit Result | Action | Cost | Timeline |
|---|---|---|---|
| Architecture problems found, under 2K DAU | Optimize on Bubble | $5K–$15K | 2–4 weeks |
| One bottleneck (search, processing), rest is fine | Hybrid architecture | $5K–$20K | 2–6 weeks |
| Clean architecture, still slow at scale | Migrate to custom code | $20K–$60K | 8–16 weeks |
| WU costs above $500/mo after optimization | Migrate (financial trigger) | $20K–$60K | 8–16 weeks |
| Compliance or native features needed | Migrate (capability trigger) | $20K–$60K | 8–16 weeks |
Whether you optimize or migrate, you need to understand your app's architecture first. An architecture blueprint shows: which data types have missing privacy rules (optimization target), which queries are inefficient (optimization target), and the complete scope of what needs rebuilding (migration specification). Extract your architecture as the first step regardless of which path you choose.
Frequently Asked Questions
Q. How long does a performance audit take?
A basic audit using Bubble's built-in tools (Server Logs, Debugger, WU meter) takes 2 to 3 days. A comprehensive audit that includes architecture analysis, data model review, and optimization recommendations takes 5 to 7 days. Automated architecture extraction produces the data model analysis in minutes, leaving the developer to focus on performance profiling.
Q. Can I do the audit myself, or do I need a Bubble expert?
The measurement phase (page load times, WU consumption, API response times) can be done by anyone with browser dev tools. Interpreting the results and identifying root causes requires Bubble architecture knowledge — understanding privacy rules, search optimization, and data model patterns. If you lack this expertise, the audit cost ($1K–$3K with a Bubble consultant) is still far cheaper than a premature migration.
Q. What is the typical performance improvement from optimization?
Published case studies show 30 to 60 percent improvement in page load times and 30 to 60 percent reduction in WU consumption from architecture optimization alone. Individual results depend on how many of the five performance killers are present in your app. Apps with missing privacy rules and client-side filtering often see 50 to 70 percent improvement from fixing those two issues alone.
Q. My app is slow on mobile. Is that a Bubble problem?
Partially. Bubble apps load heavier payloads than optimized native or custom web apps, which affects mobile performance disproportionately on slower connections. However, the same optimization techniques (privacy rules, server-side search, satellite types) improve mobile performance significantly. If mobile speed is critical to your business and optimization does not achieve acceptable results, migration is warranted — mobile performance is one area where custom code dramatically outperforms Bubble.
Q. Should I optimize before or after getting migration quotes?
Before. An optimized app has two advantages: (1) it might eliminate the need for migration entirely, saving $20K–$60K, and (2) if migration is still needed, the optimization process documents your architecture and identifies exactly what is causing performance issues — information that produces more accurate migration quotes.
Q. How do I know if my performance problems are Bubble's fault or my architecture's fault?
Run the audit. If you find missing privacy rules, client-side filtering, nested searches, or recursive workflows — that is architecture. Fix those first. If your architecture is clean and performance is still inadequate at your scale, that is the platform. The audit separates the two definitively.
Measure First, Then Decide
- Audit before you migrate: A $1K–$3K audit prevents a $30K mistake. Measure page load times, WU consumption, API response times, and query performance before making any commitment. Data replaces frustration as the decision driver.
- Five patterns cause 90% of performance problems: Missing privacy rules, client-side filtering, nested searches, recursive workflows, and bloated data types. Fix these before concluding that Bubble is the problem.
- WU forensics reveal the real costs: The top 10 most expensive operations typically consume 70 to 80 percent of your WU budget. Find them, fix them, and your bill drops proportionally.
- Recognize the optimization ceiling: After implementing all fixes, if performance is still inadequate at your scale, the platform is the bottleneck — not your architecture. This is when migration becomes the rational choice.
- Architecture documentation serves both paths: Whether you optimize or migrate, understanding your complete architecture is the prerequisite. Extract the blueprint first, then let the data guide your decision.
The cheapest migration is the one you do not need. And the only way to know whether you need it is to measure. Audit first. Optimize second. Migrate only when the data says you must.
Start Your Performance Audit with Architecture Data
Relis extracts your complete Bubble architecture — data schemas with field counts, API connector configurations, backend workflow inventories — giving you the blueprint for both optimization and migration decisions.
Scan My App — FreeHow Complex Is Your Bubble App?
Find out in minutes. Relis automatically extracts and documents your entire Bubble architecture — data types, APIs, workflows, and settings.
How Complex Is Your Bubble App?
Find out in minutes. Relis automatically extracts and documents your entire Bubble architecture — data types, APIs, workflows, and settings.